DBT Studio
Overview
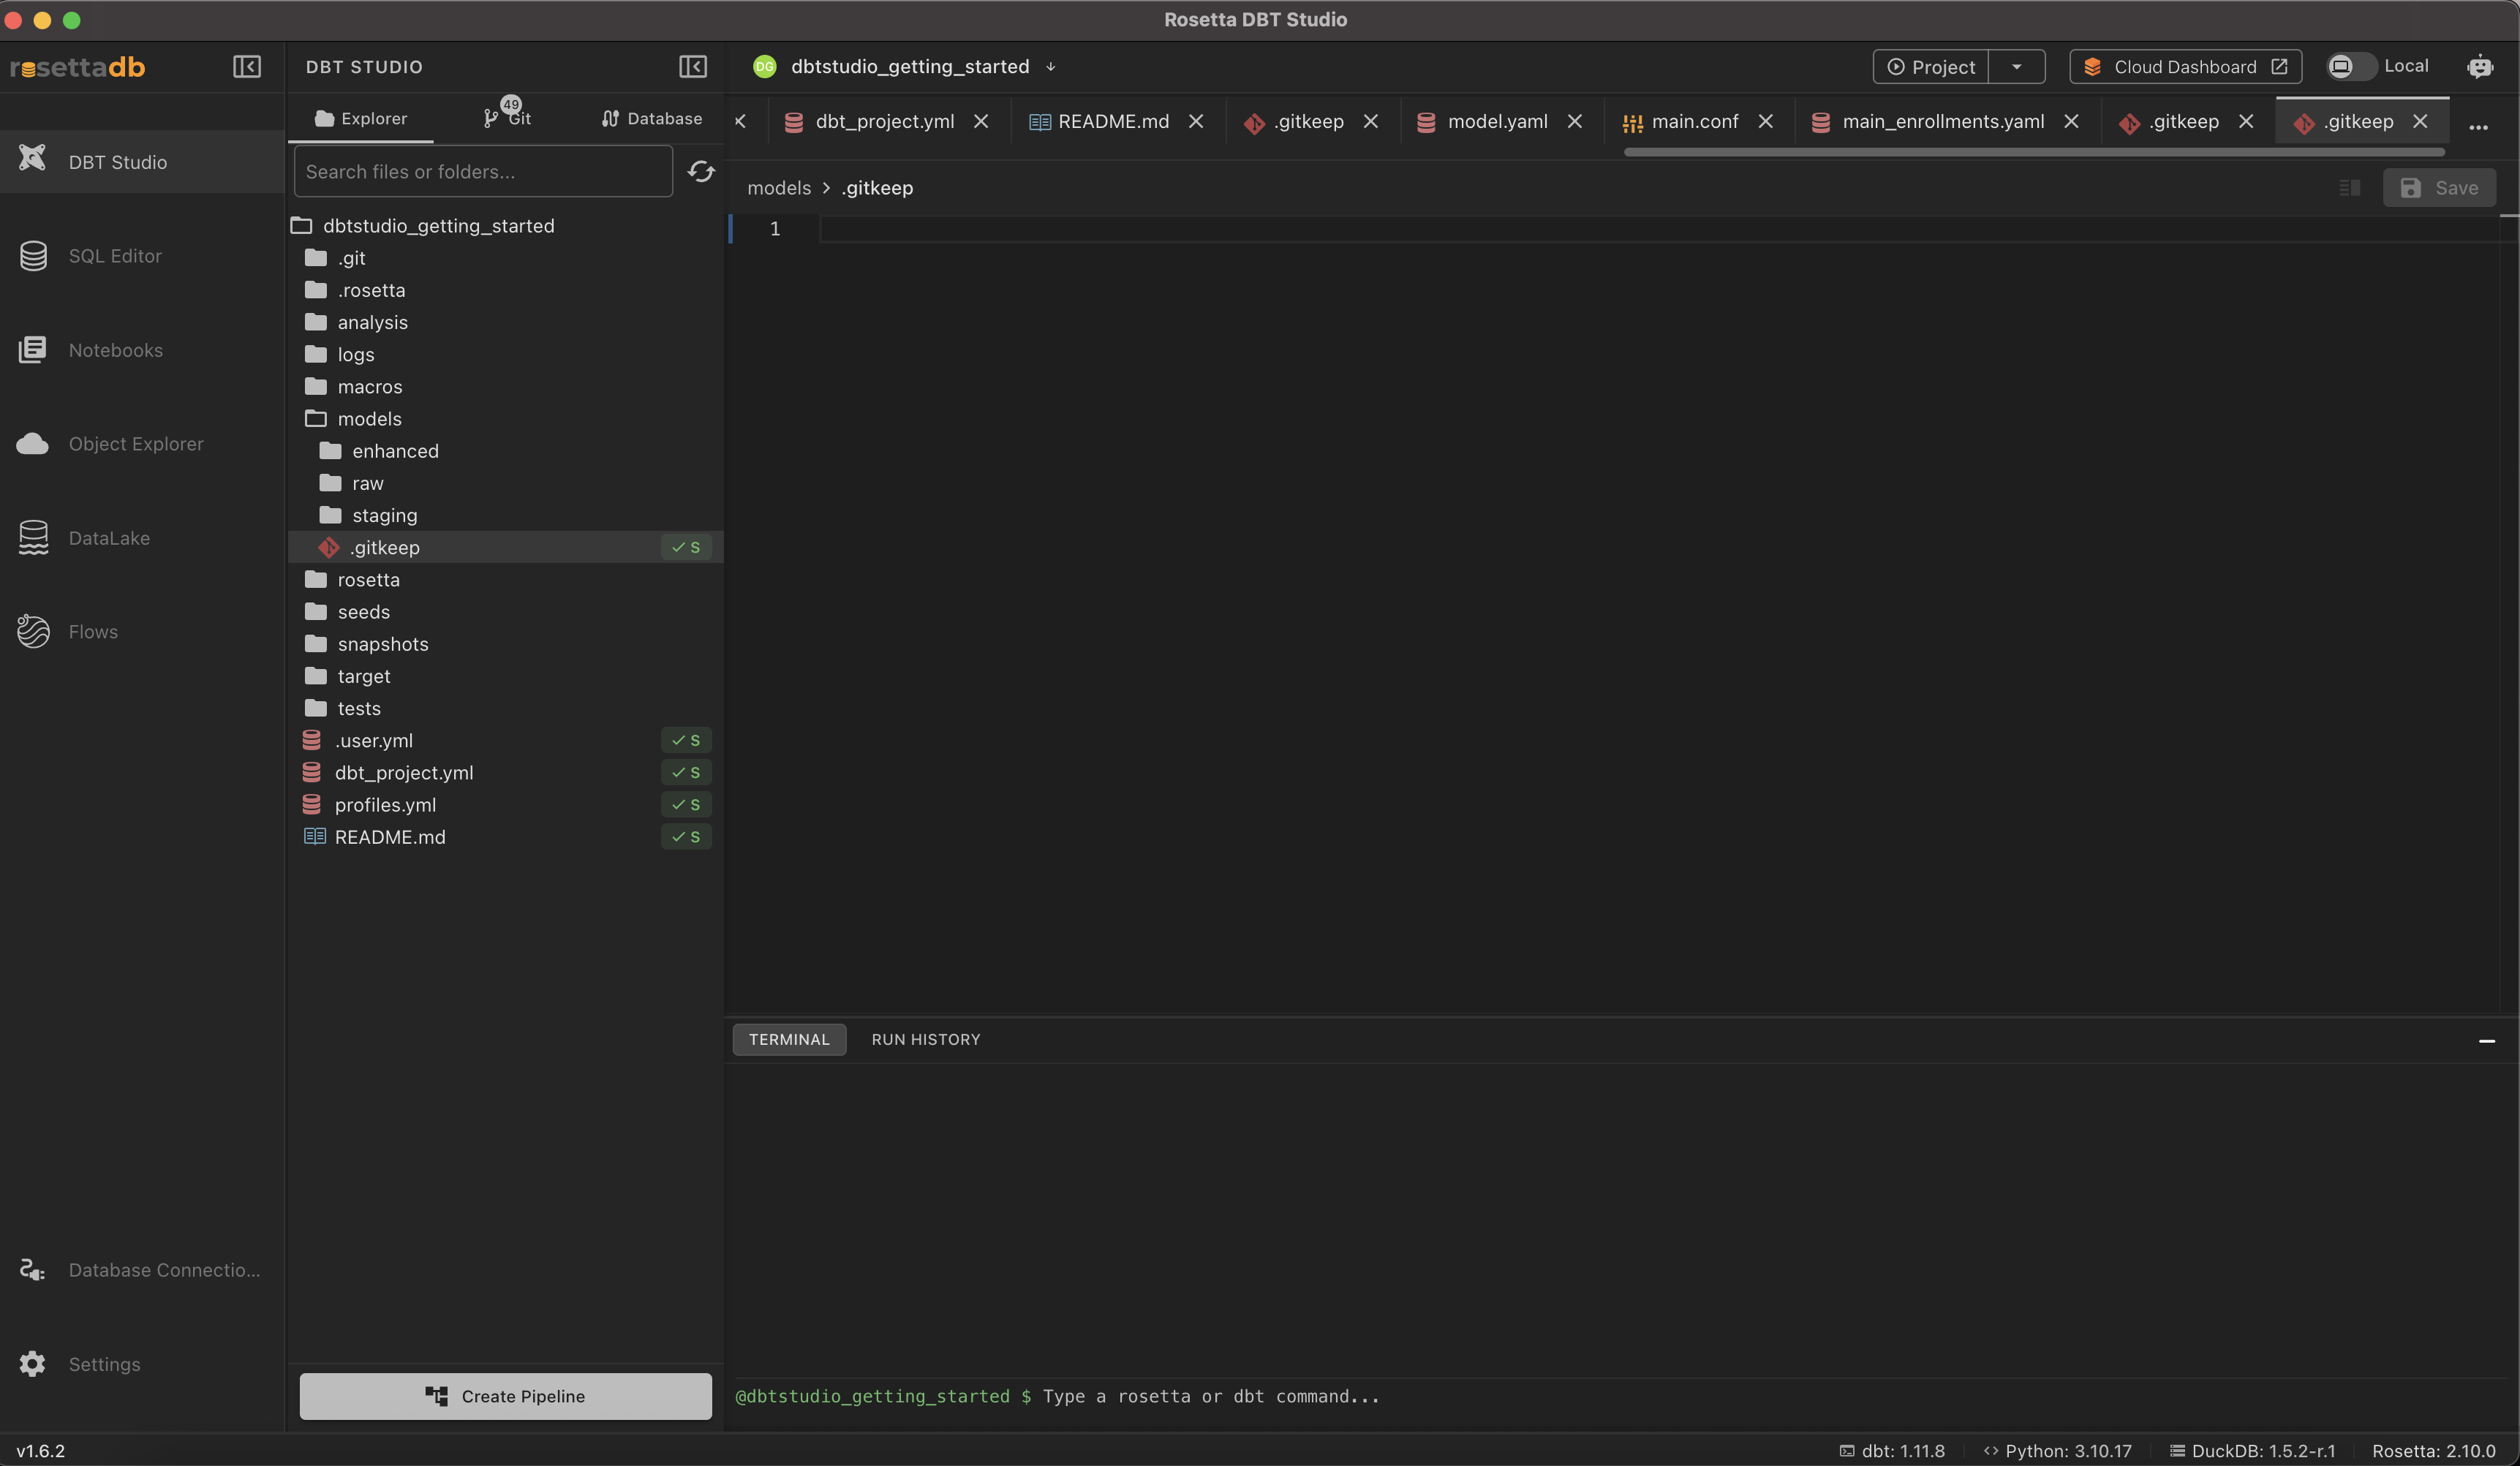
DBT Studio is the main workspace in Rosetta DBT Studio — the screen you'll spend most of your time in. It's where your project's files live, where you write and edit models, run dbt™ commands, and manage version control, all in one place.
Open it from DBT Studio in the left sidebar. It's the screen you land on whenever you open a project.
The Panel Tabs
The left panel has three tabs, each a different way of looking at your project:
- Explorer — your project's file tree, for browsing and opening files
- Git — commit, branch, and push changes without leaving the app. See Git Integration.
- Database — browse your connected database's schema, separately from your project files
The File Explorer
The Explorer shows your full dbt™ project structure — the same folders any dbt project has:
- models — your SQL models, organized into
raw,staging, andenhancedlayers (and abusinesslayer, generated with AI) - seeds — CSV files you load in as tables
- snapshots — point-in-time snapshots of changing data
- tests — custom data tests
- macros — reusable Jinja snippets
- analysis — ad hoc SQL not meant to be built as a model
- Project files —
dbt_project.yml,profiles.yml,.user.yml,README.md, and others
Click any file to open it. Multiple files stay open as tabs across the top of the editor, so you can move between them without losing your place.
For the full walkthrough of building through the Raw → Staging → Enhanced layers, see Getting Started.
The Editor
This is where you write and edit SQL. Model files support the usual editing conveniences — syntax highlighting, autocomplete for dbt™ and Jinja.
Models can also be generated here with AI assistance, rather than written by hand — see AI Assistant for how that works, including the AI-only Business layer.
The Bottom Panel
Below the editor:
- Terminal — run
dbtandrosettacommands directly against your project. See dbt™ Commands for what each command does. - Run History — a log of commands and queries you've already run, so you can revisit what happened without re-running it.
Create Pipeline
The Create Pipeline button, at the bottom of the Explorer panel, opens a visual builder for chaining dbt™ commands into a single job. See Pipeline Builder for the full walkthrough.
Video
For a walkthrough of exploring your project's model dependencies, see the official video: Rosetta DBT Studio - DBT Lineage & DAG
Common Issues
A file I created isn't showing in the Explorer → Click the refresh icon at the top of the Explorer panel.
I don't see my database's tables → Switch to the Database tab, and confirm your connection is set up correctly.
My changes aren't showing in Git → Switch to the Git tab and click refresh — it re-scans the project for changes.