SQL Editor
Overview
The SQL Editor lets you write and run SQL directly against your connected database. It's where you explore your data — check what's in a table, test a query, or inspect results — without building dbt™ models.
Because it reads from your database connection, make sure you have a connection set up first (see Database Connections).
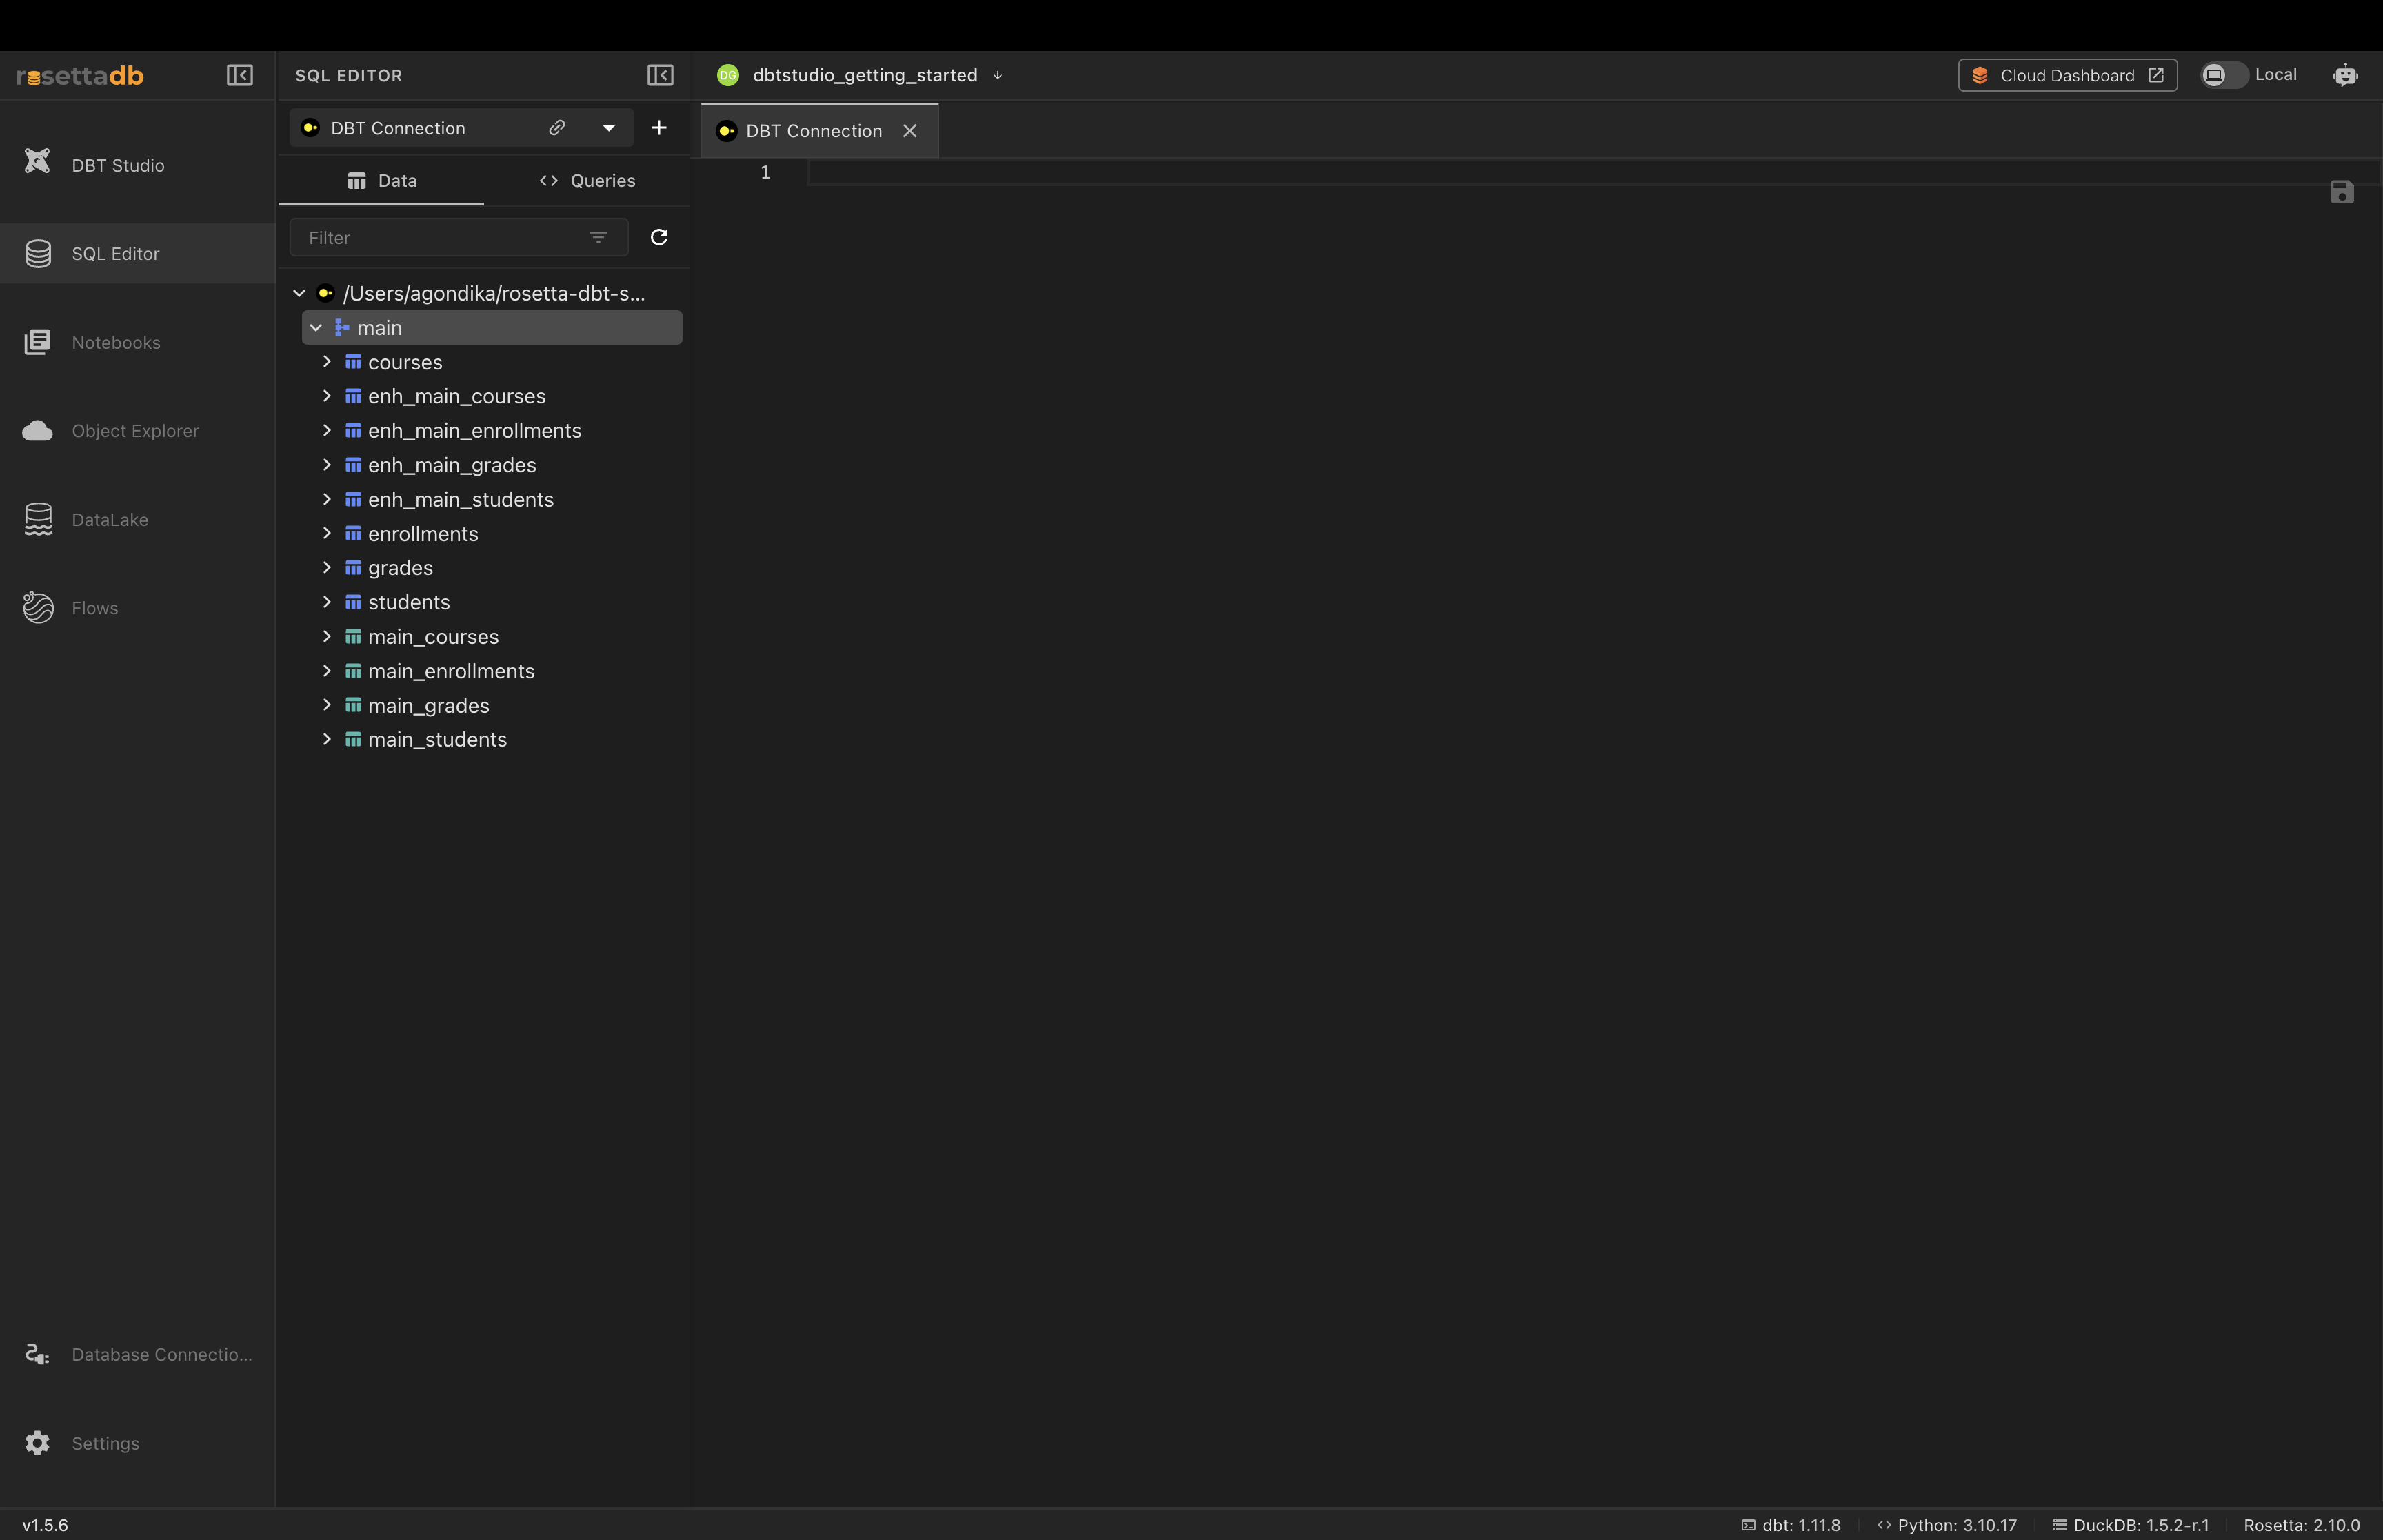
The Data Panel
The left panel has two tabs:
- Data — a browser of your connection's schemas and tables. Expand a schema (such as
main) to see every table you can query. - Queries — your saved queries.
Use the Filter box to find a table quickly, and the refresh icon to reload the list after your data changes.
Writing and Running a Query
- Type your SQL in the editor area on the right
- Click the Run (▶) button next to the statement, or press Cmd/Ctrl + Enter
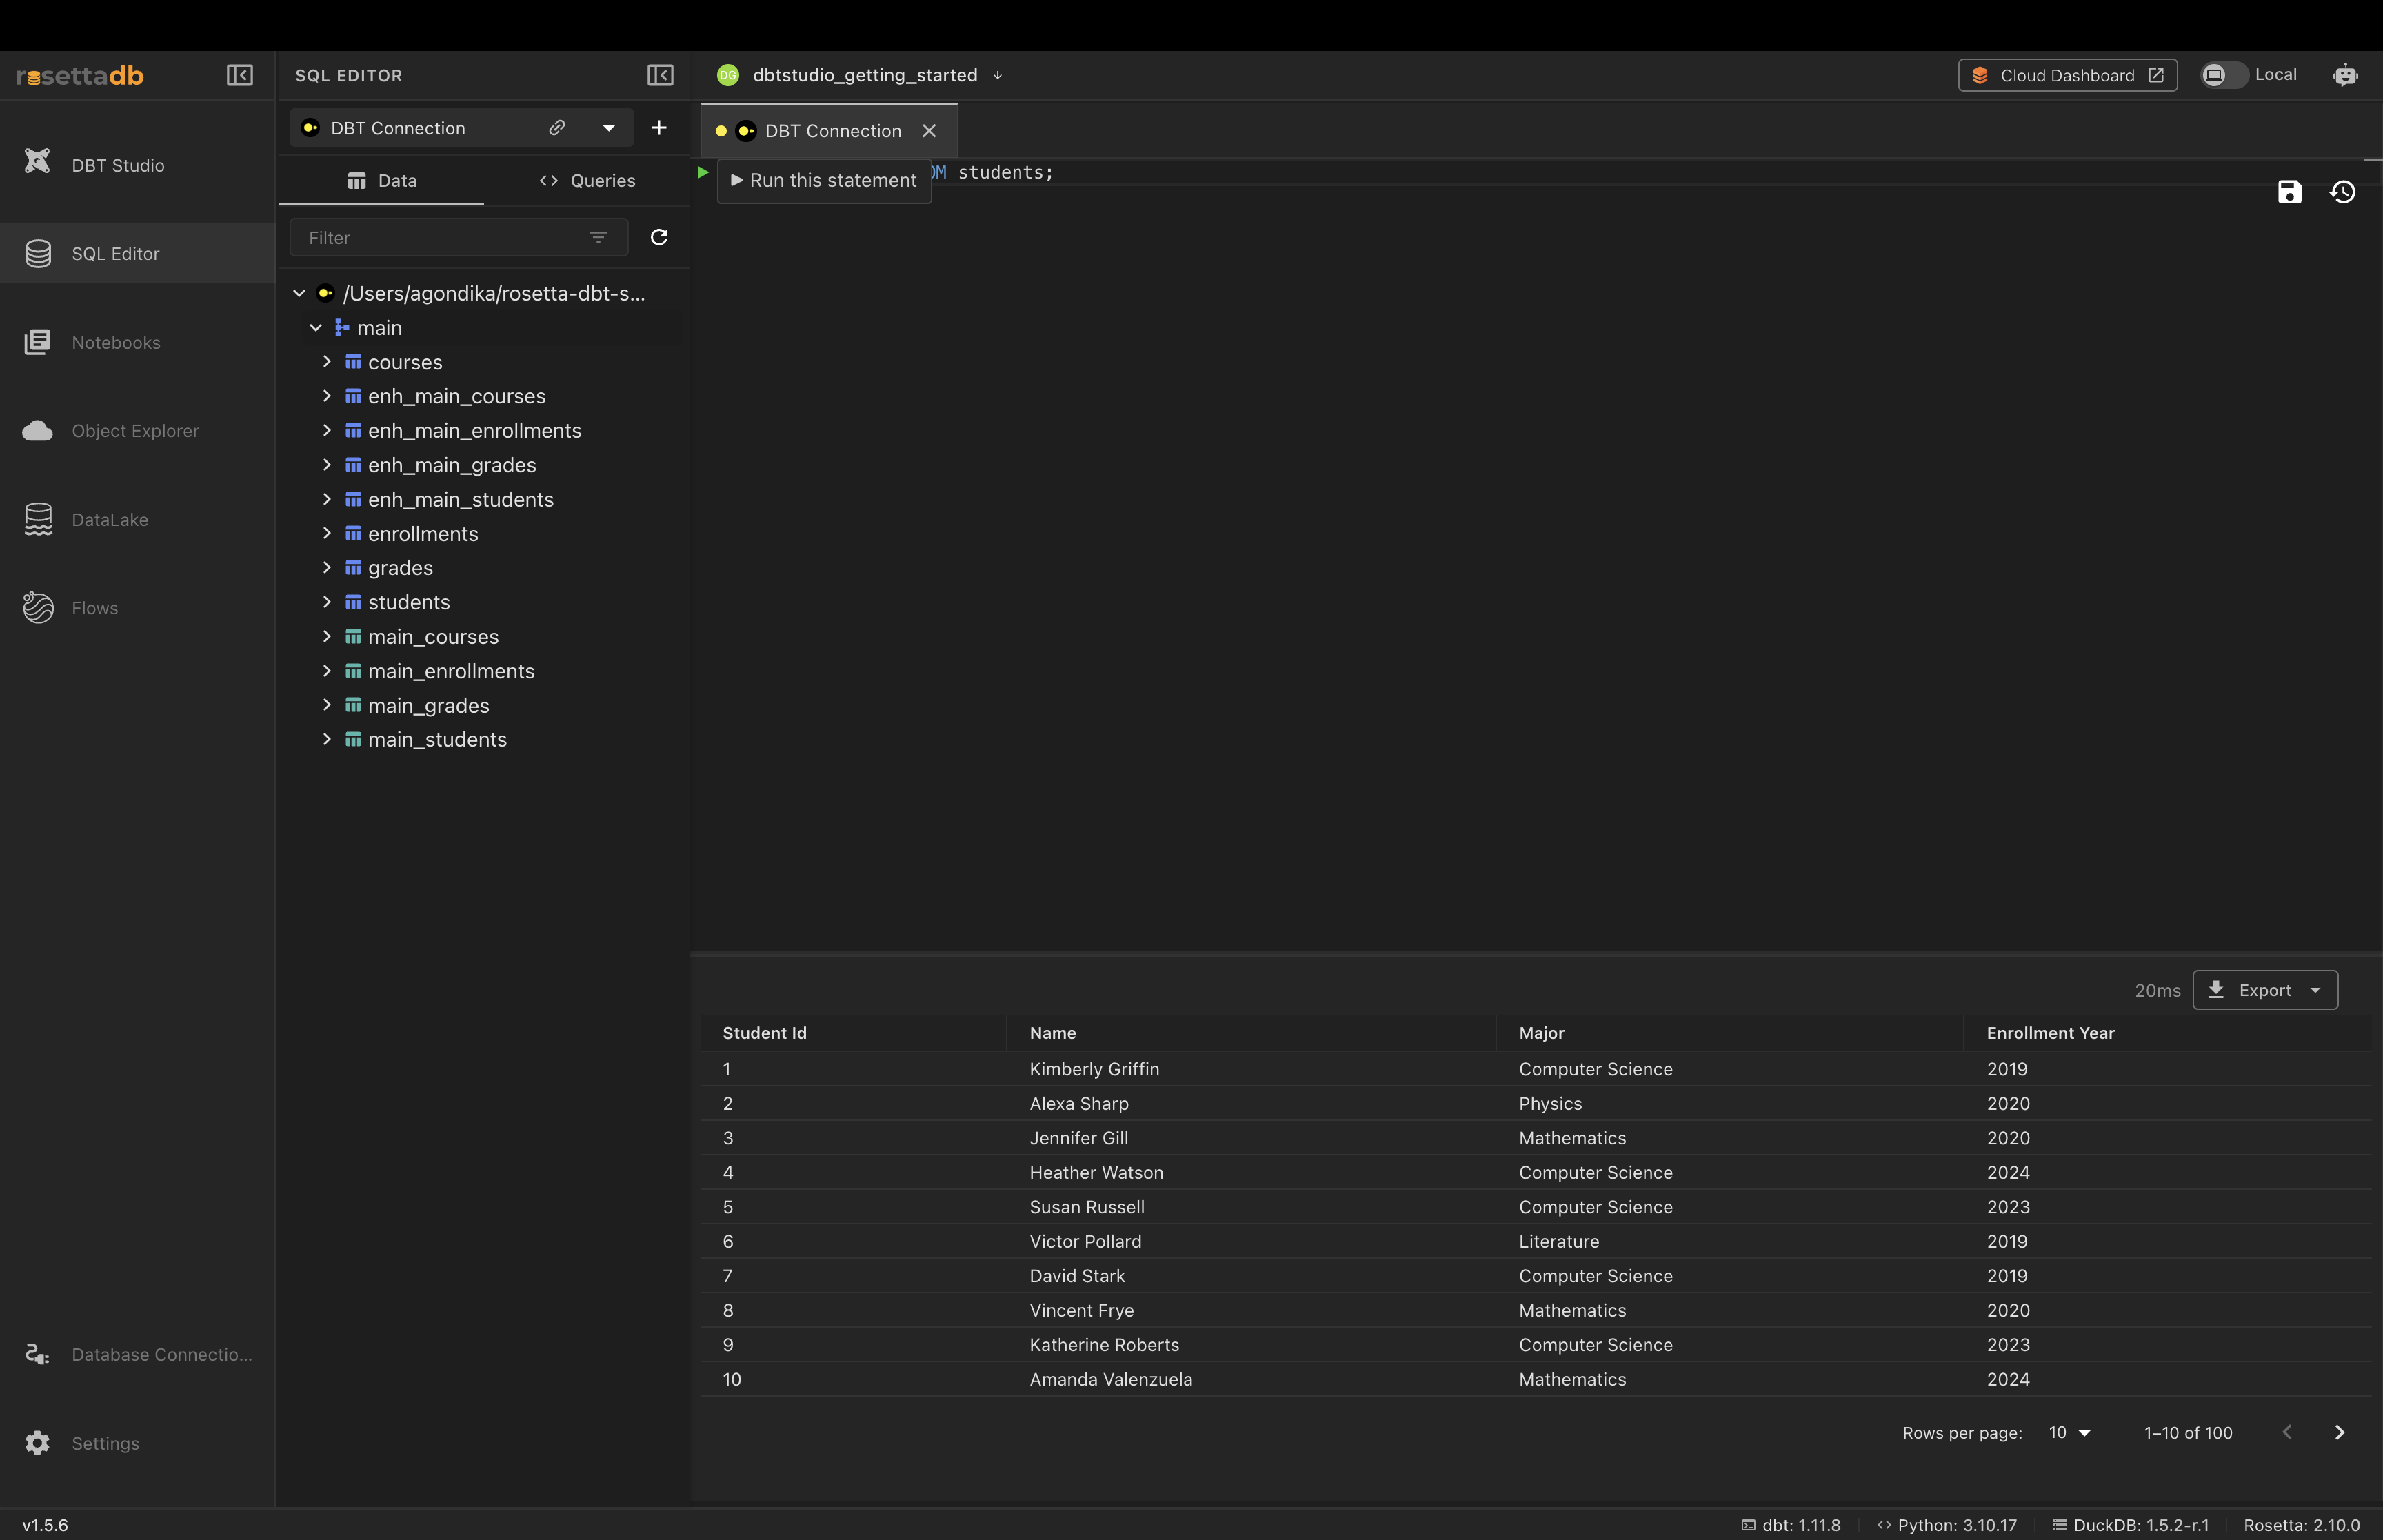
Results appear in a table below, along with:
- Query time — how long the query took
- Pagination — use Rows per page and the arrows to page through large result sets
- Export — download the results (see below)
Tip: The Save and history icons at the top right let you save a query for reuse and revisit recently run queries.
Query Results and Run History
The panel below the editor has its own tabs for reviewing past activity:
- Query Results — the results of your most recent query
- Run History — a log of previously run queries, so you can revisit or re-check what you ran earlier without writing it again
Exporting Results
Click Export on the results panel to download your query output as:
- CSV
- JSON
- Parquet
Visualizing Results as a Chart
Instead of reading rows in a table, you can turn query results into a chart directly in the editor.
- Run your query
- Click the Chart toggle next to Export
- Use the Chart Configuration panel to set:
- Chart Type — Bar, Line, Pie, or Scatter Plot
- X-Axis (Category) — the column for categories
- Y-Axis (Metrics) — the column for values
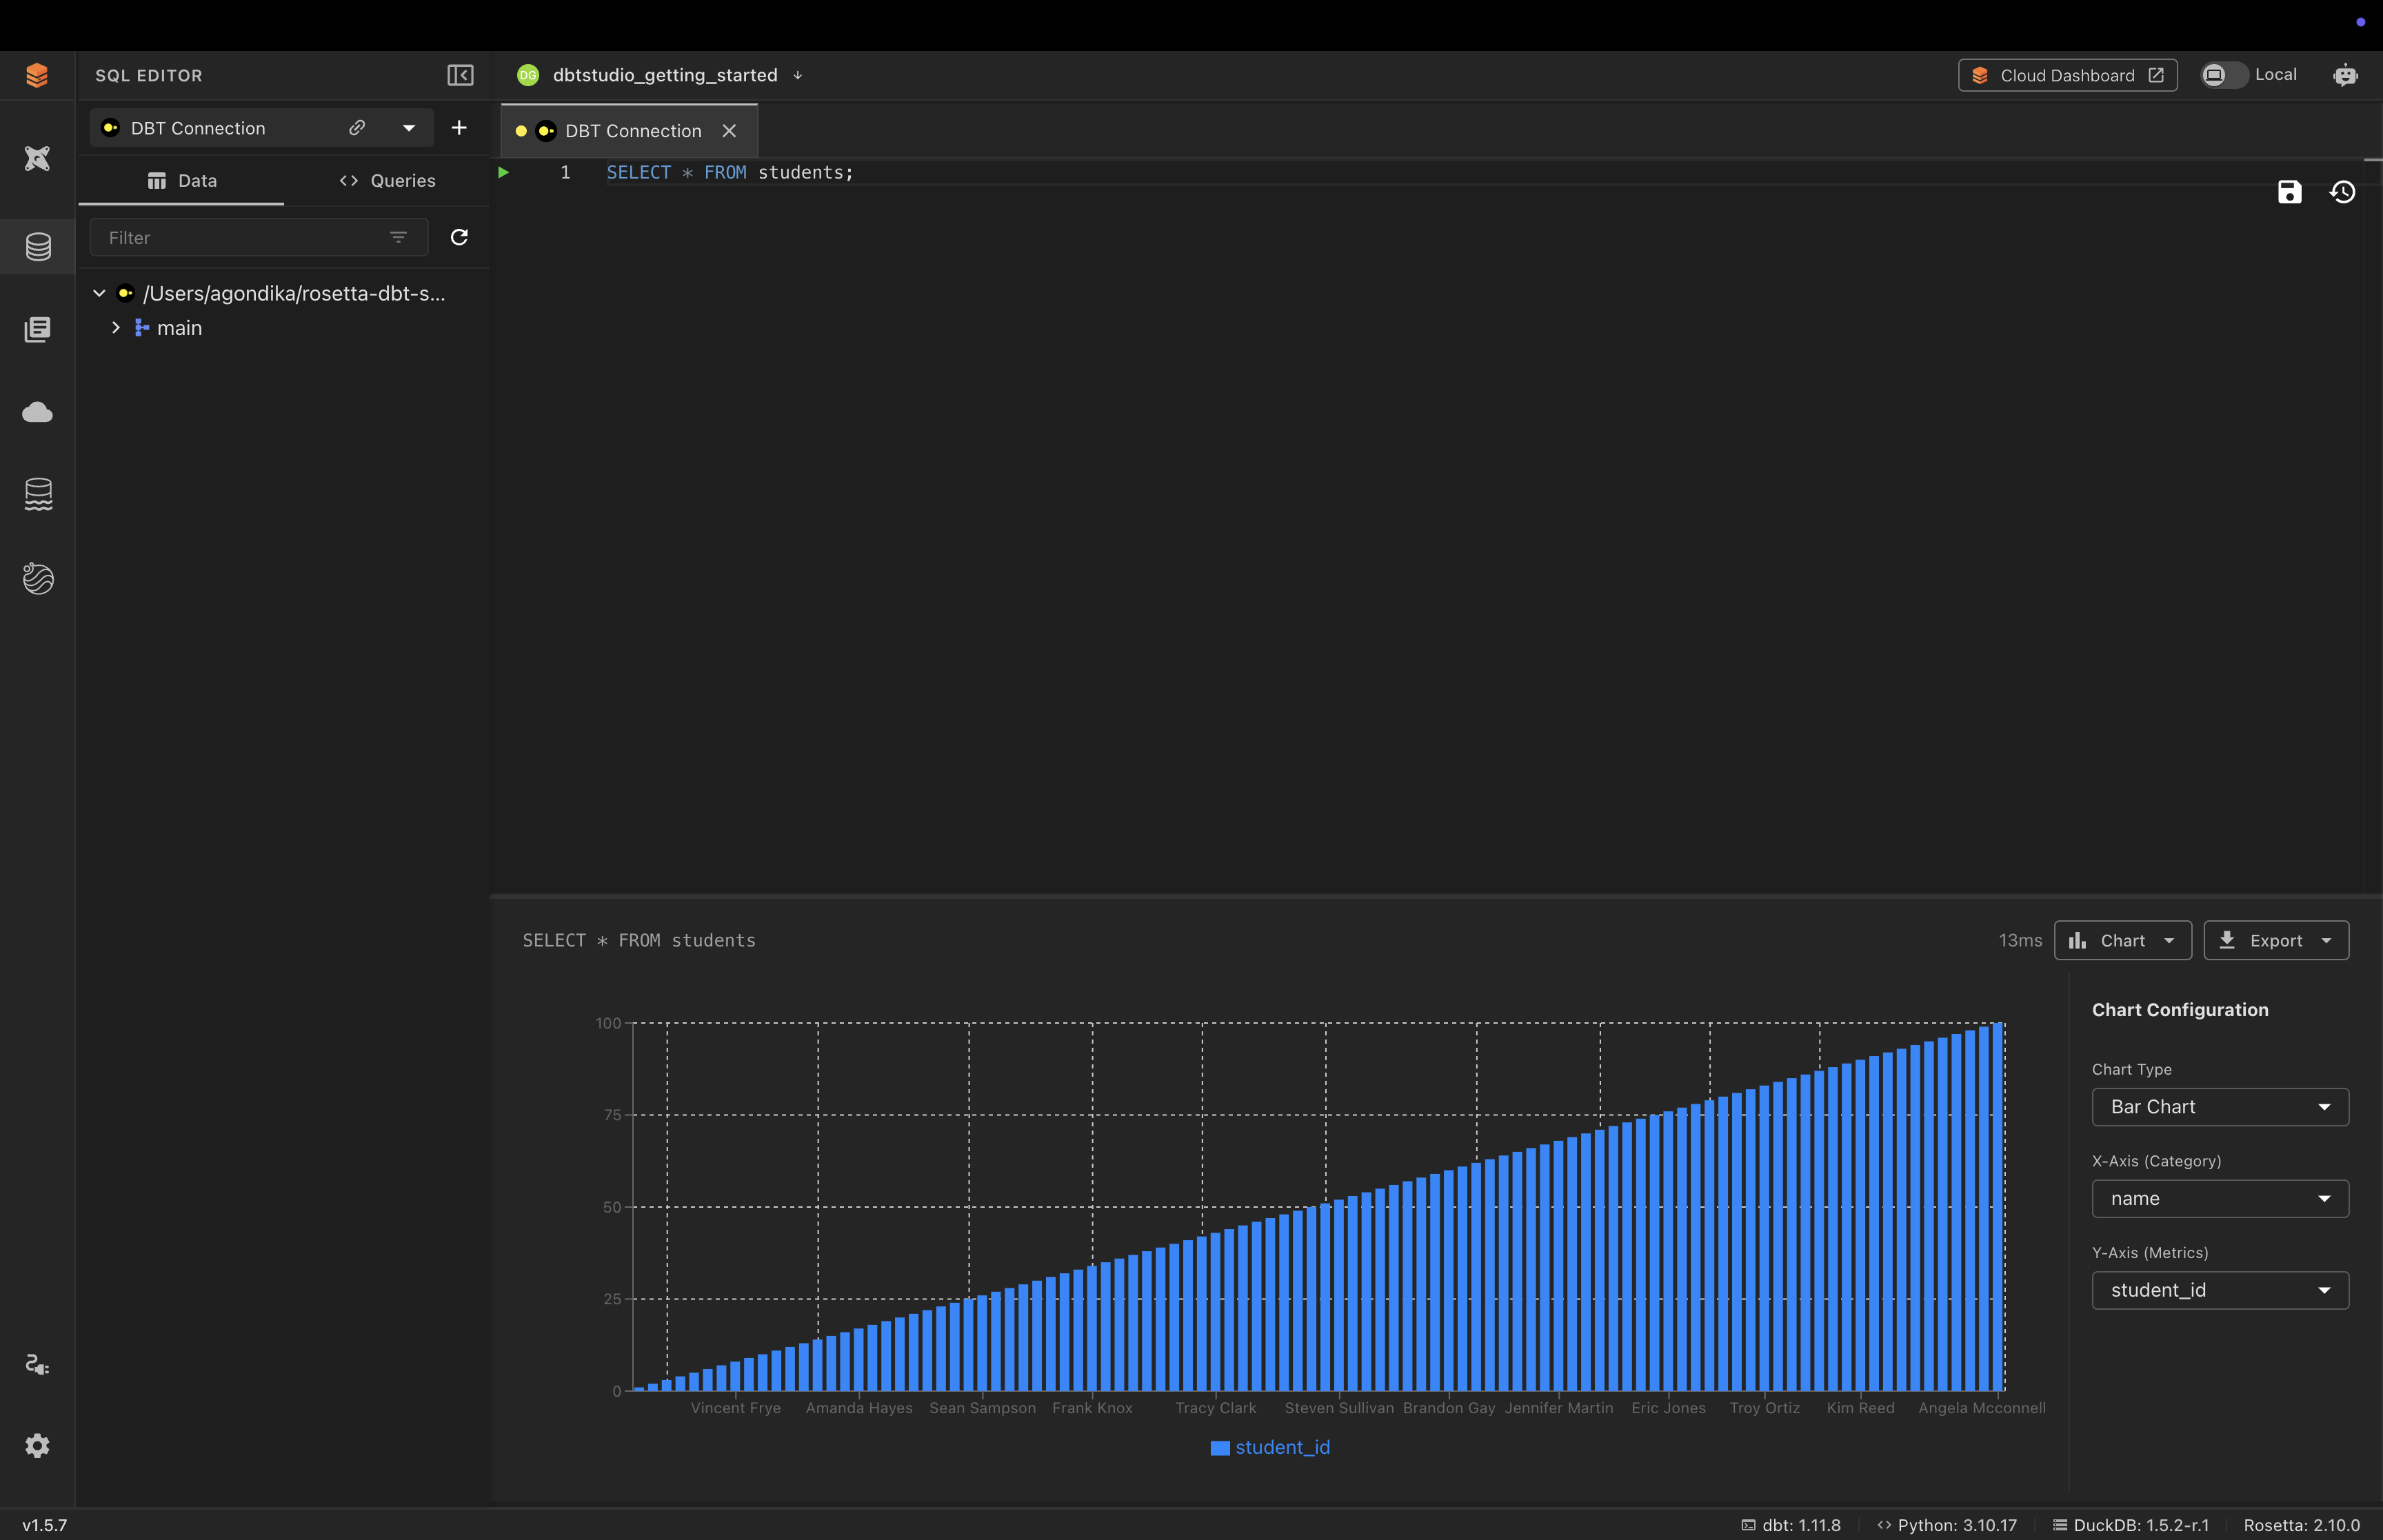
The chart updates as you change the configuration, giving you a quick visual of your results without leaving the editor.
Videos
For more on querying and visualizing your data, see these official videos:
Common Issues
Query returns an error → Check your SQL syntax and confirm the table name exists in the schema shown in the Data panel.
No tables appear in the Data panel → Confirm your connection is set up correctly on the Database Connections screen, then click the refresh icon.
Chart looks wrong or empty → Make sure the columns selected for the X and Y axes suit the chart — the Y-Axis should be a numeric column.