Notebooks
Overview
A notebook lets you break your SQL work into a series of cells — each cell holds its own query and shows its own results right beneath it. You run them one at a time, top to bottom.
If you've used Jupyter notebooks, this is the same idea, focused on SQL: instead of a single query like the SQL Editor, a notebook keeps every step and its result visible, so you can work through a whole analysis and come back to it later.
Notebooks are saved, so you can reopen and share them.
Selecting a Connection
Notebooks read from a database connection, so you pick one first.
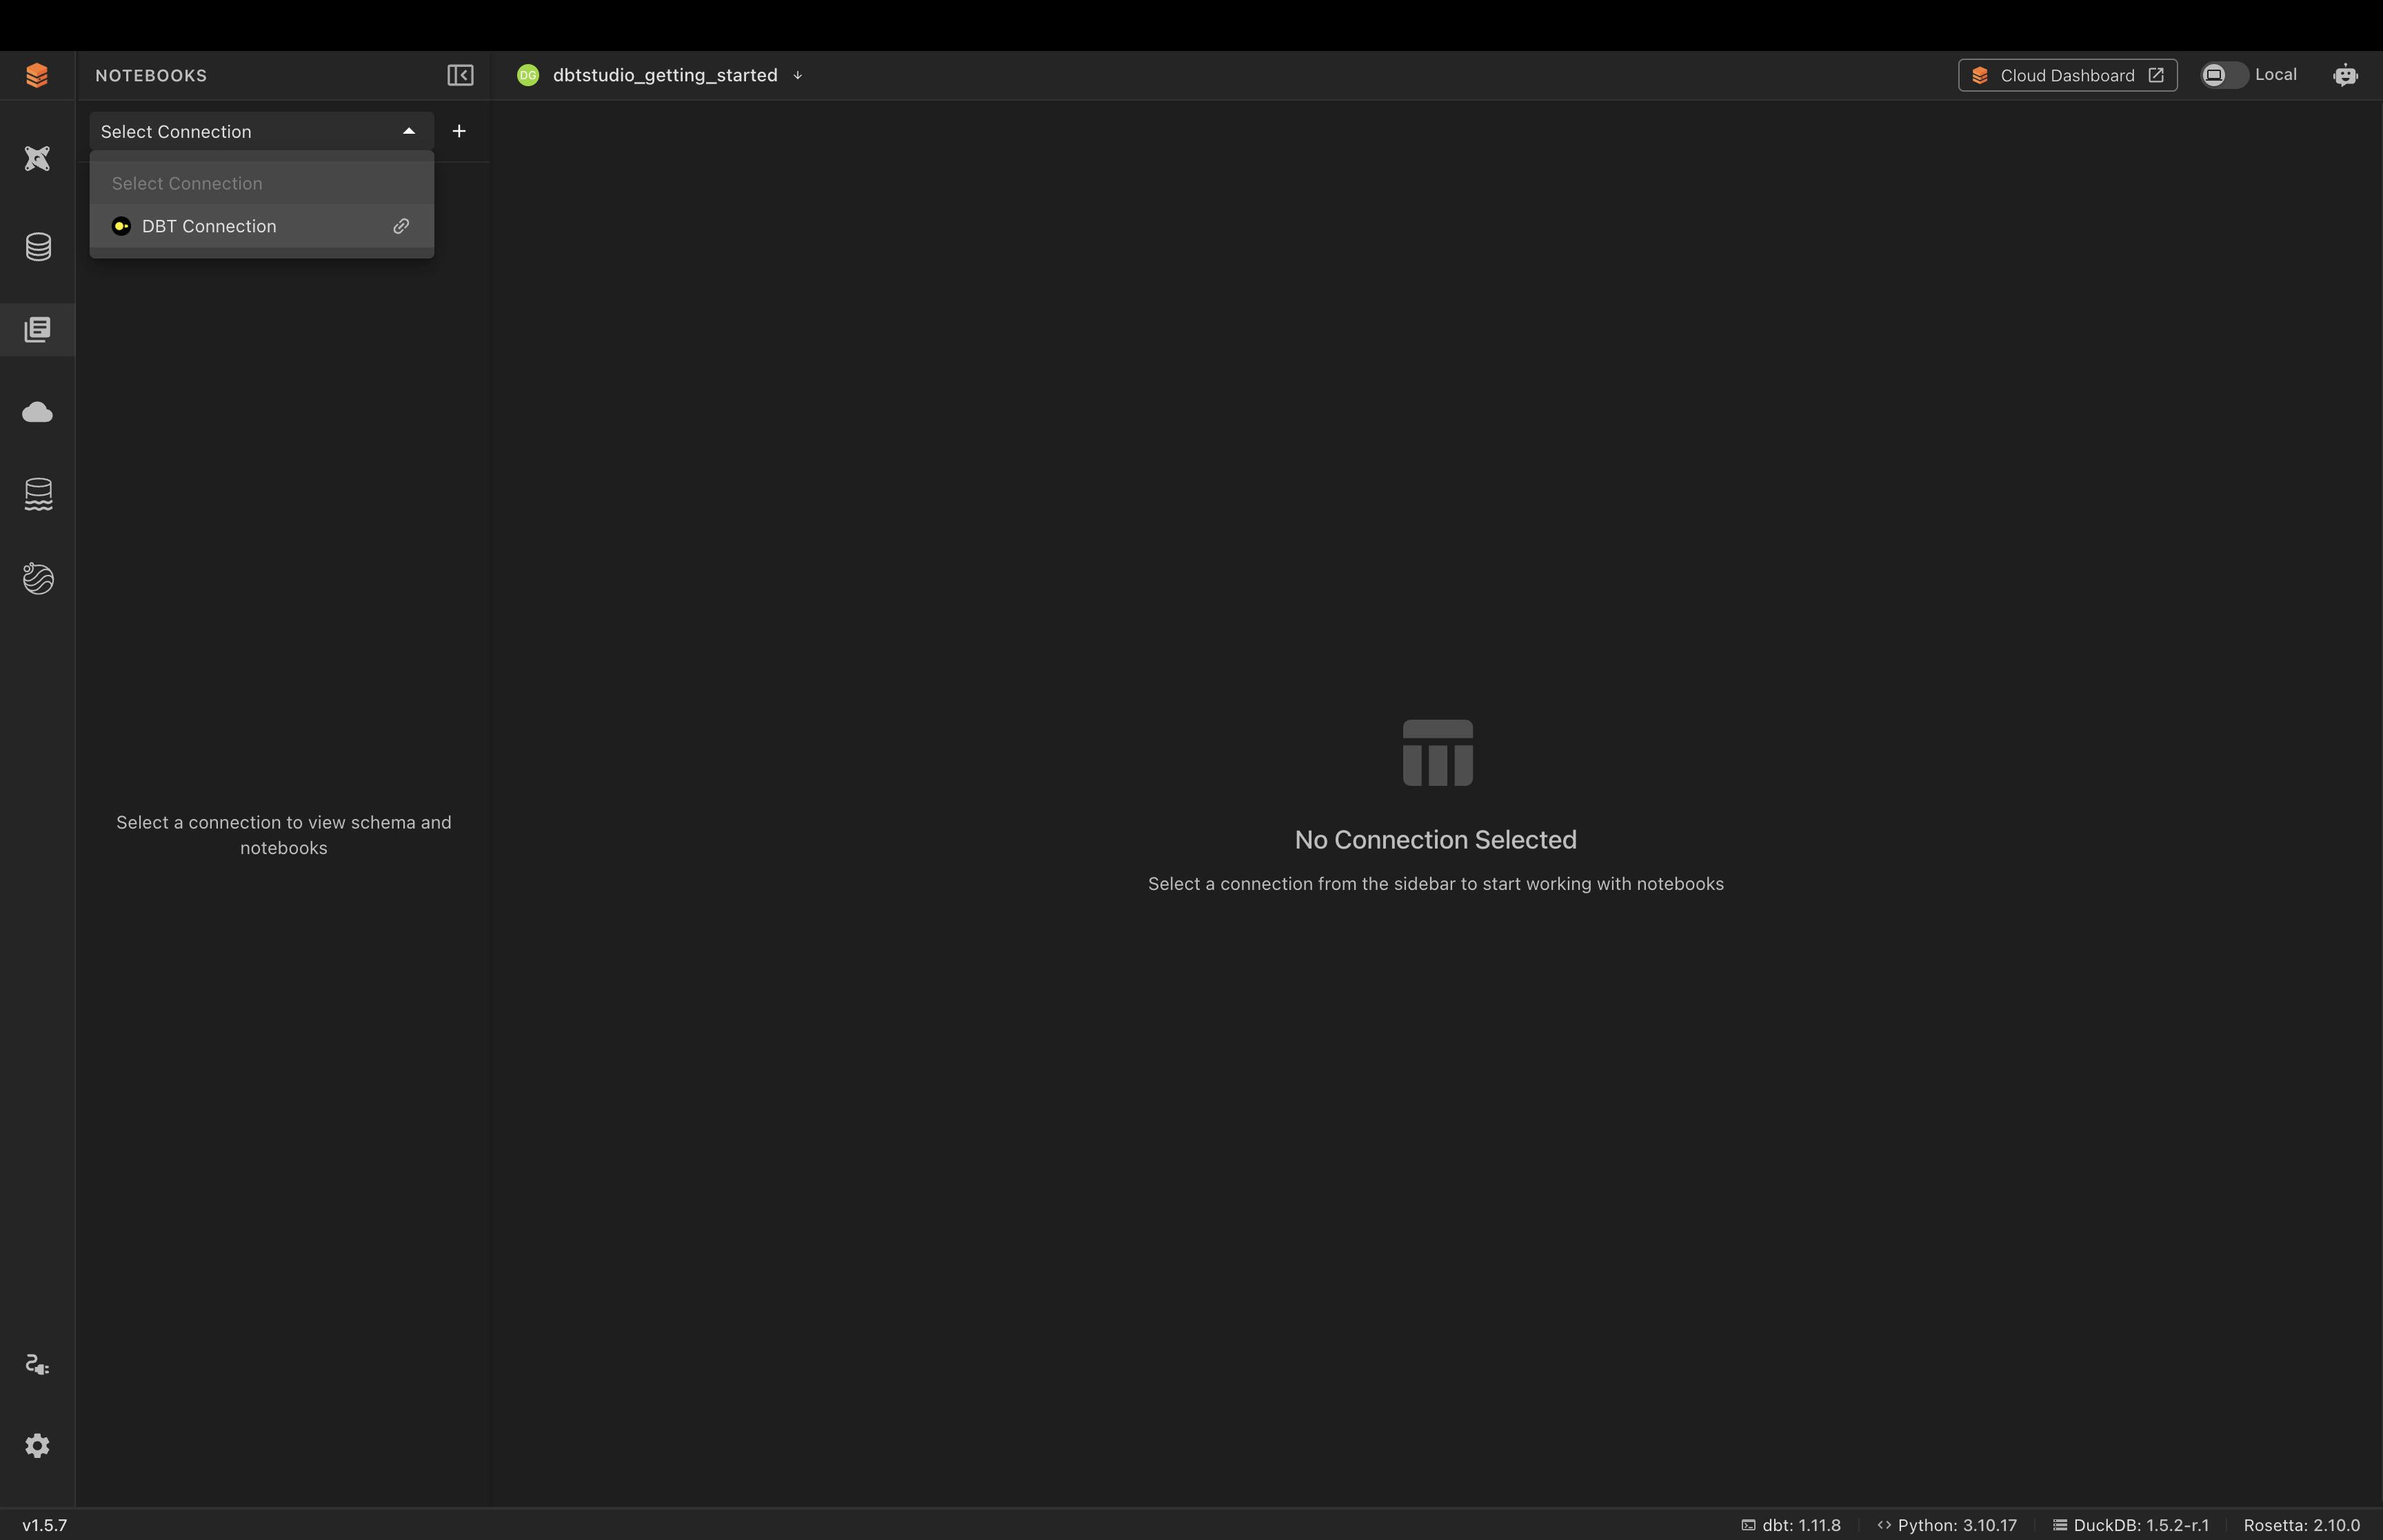
Choose a connection from the Select Connection dropdown at the top of the panel. Once selected, the panel shows your saved notebooks and a schema browser.
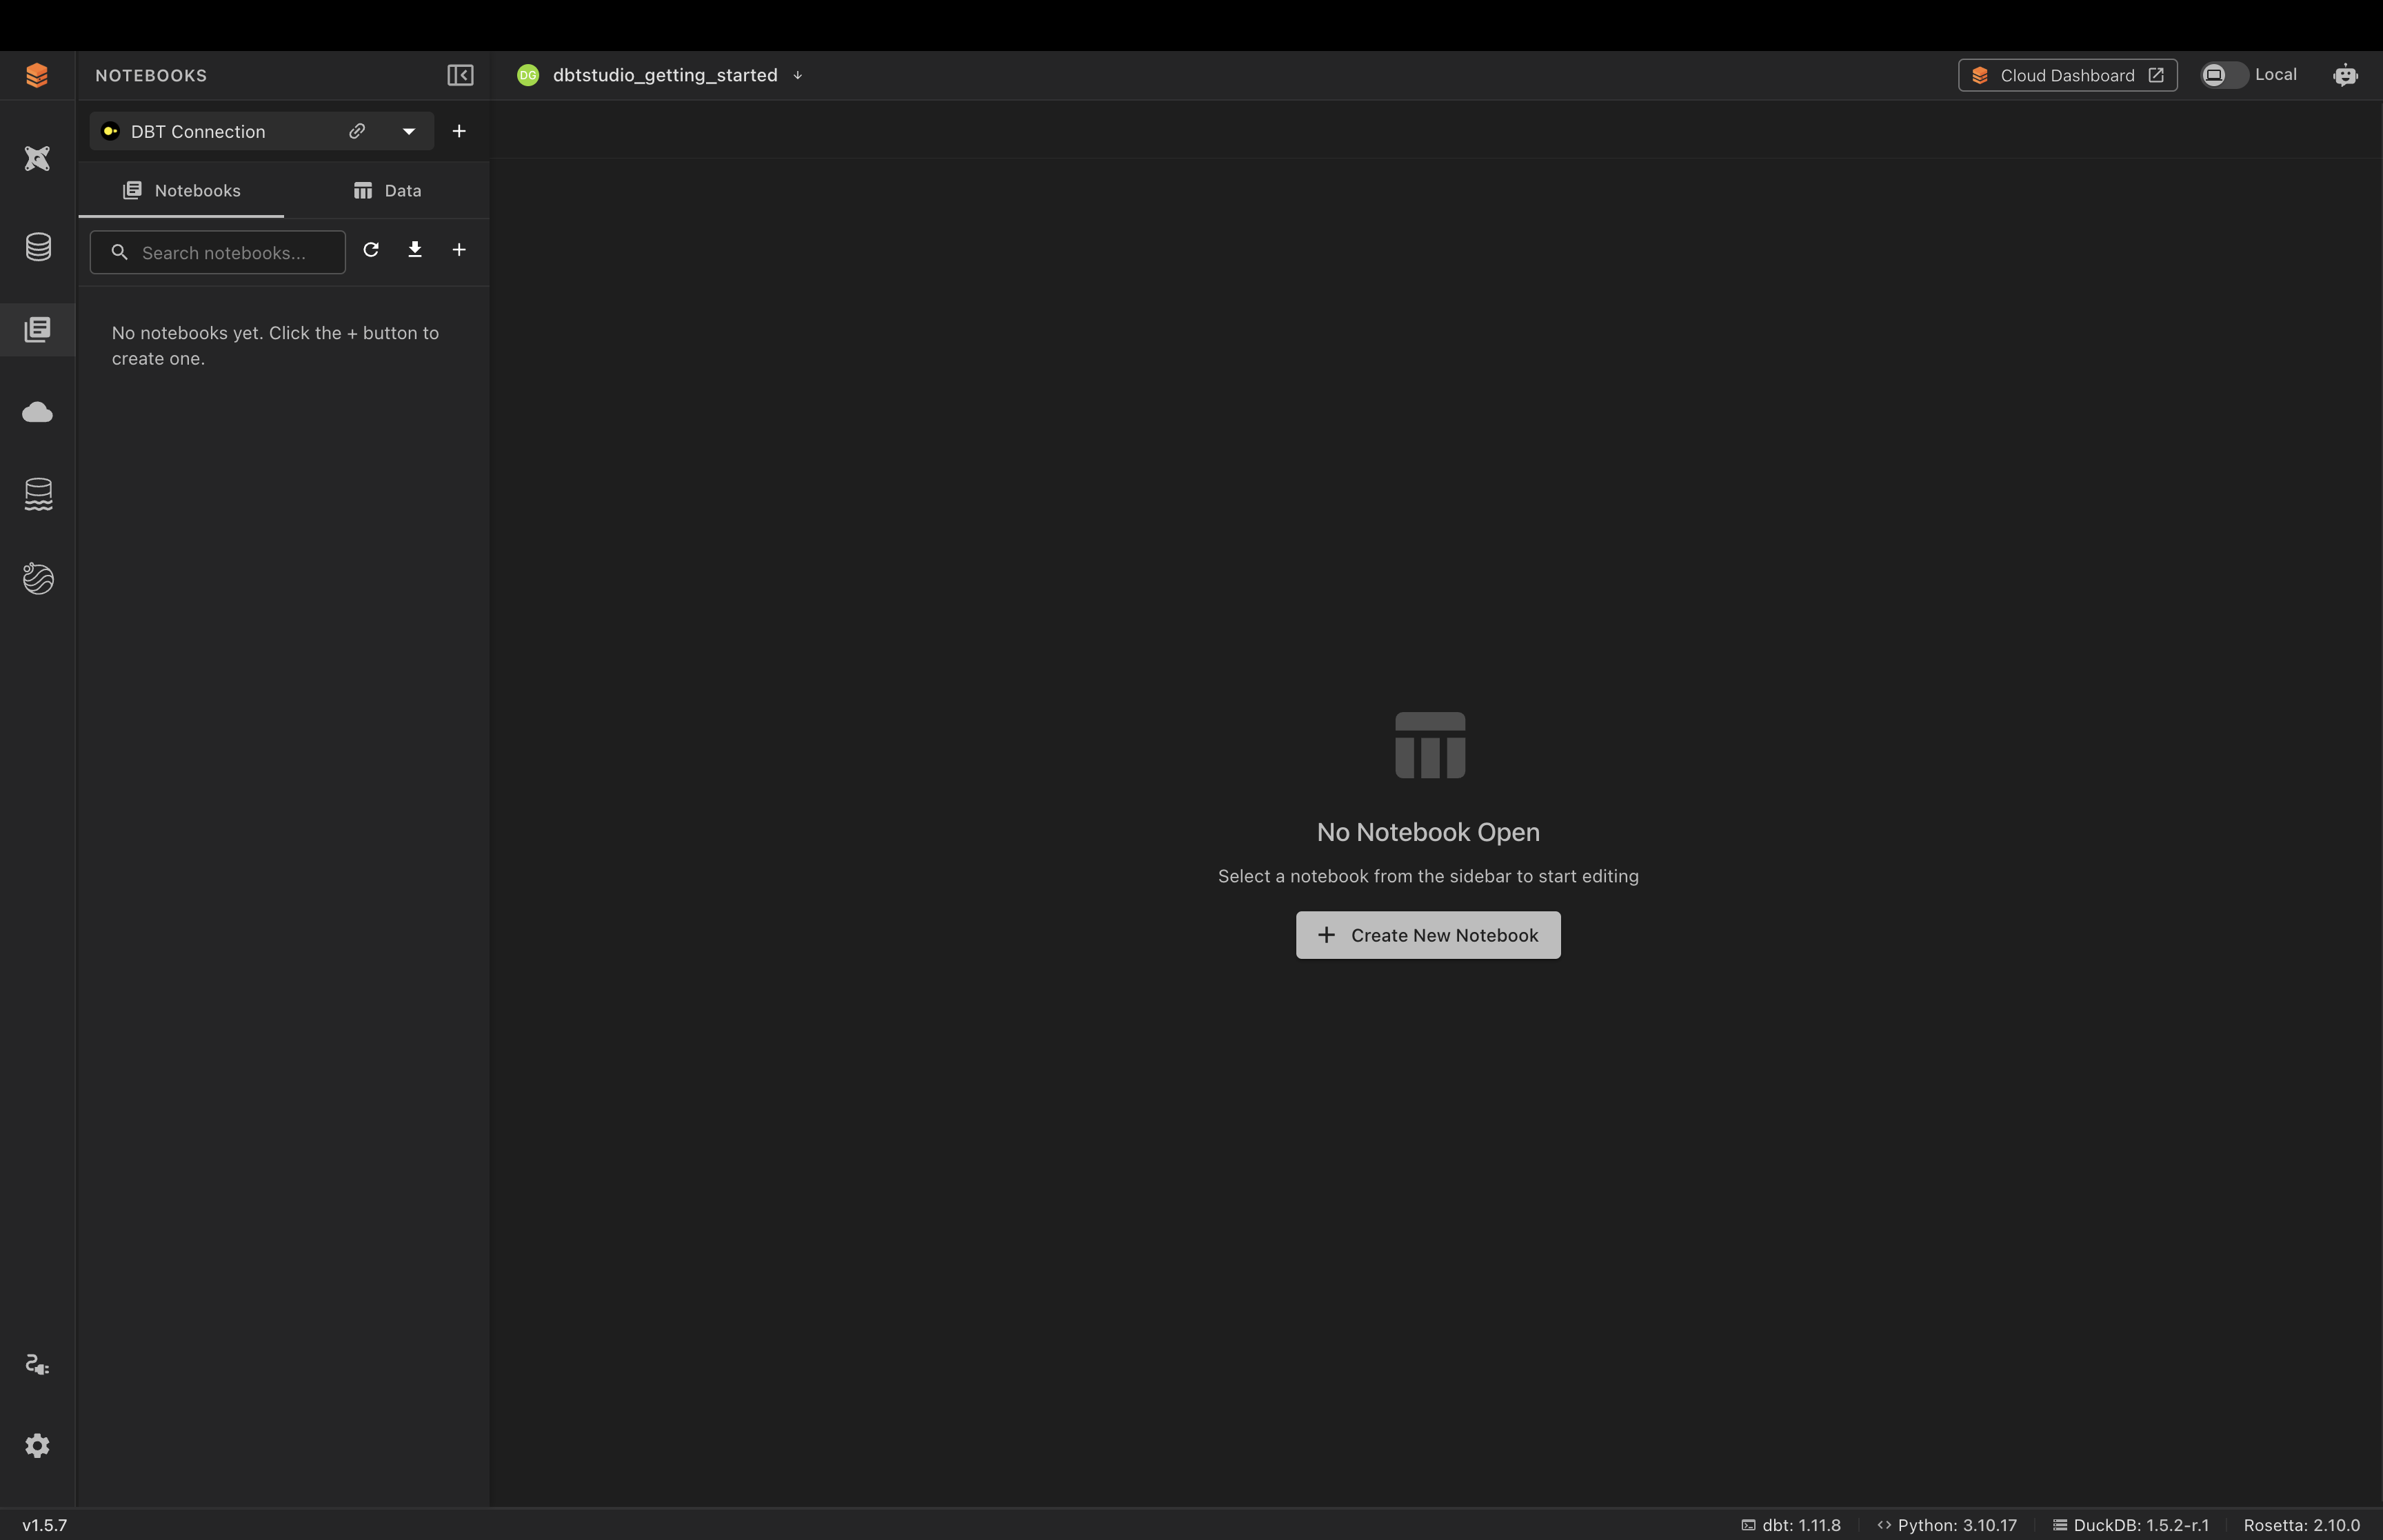
The left panel has two tabs:
- Notebooks — lists your saved notebooks under My Notebooks. This is where you find, search, and open existing notebooks. You can keep as many as you like here and switch between them.
- Data — a browser of the connection's schemas and tables, so you can see what's available to query without leaving the notebook.
Creating a Notebook
- Click the + button (or Create New Notebook)
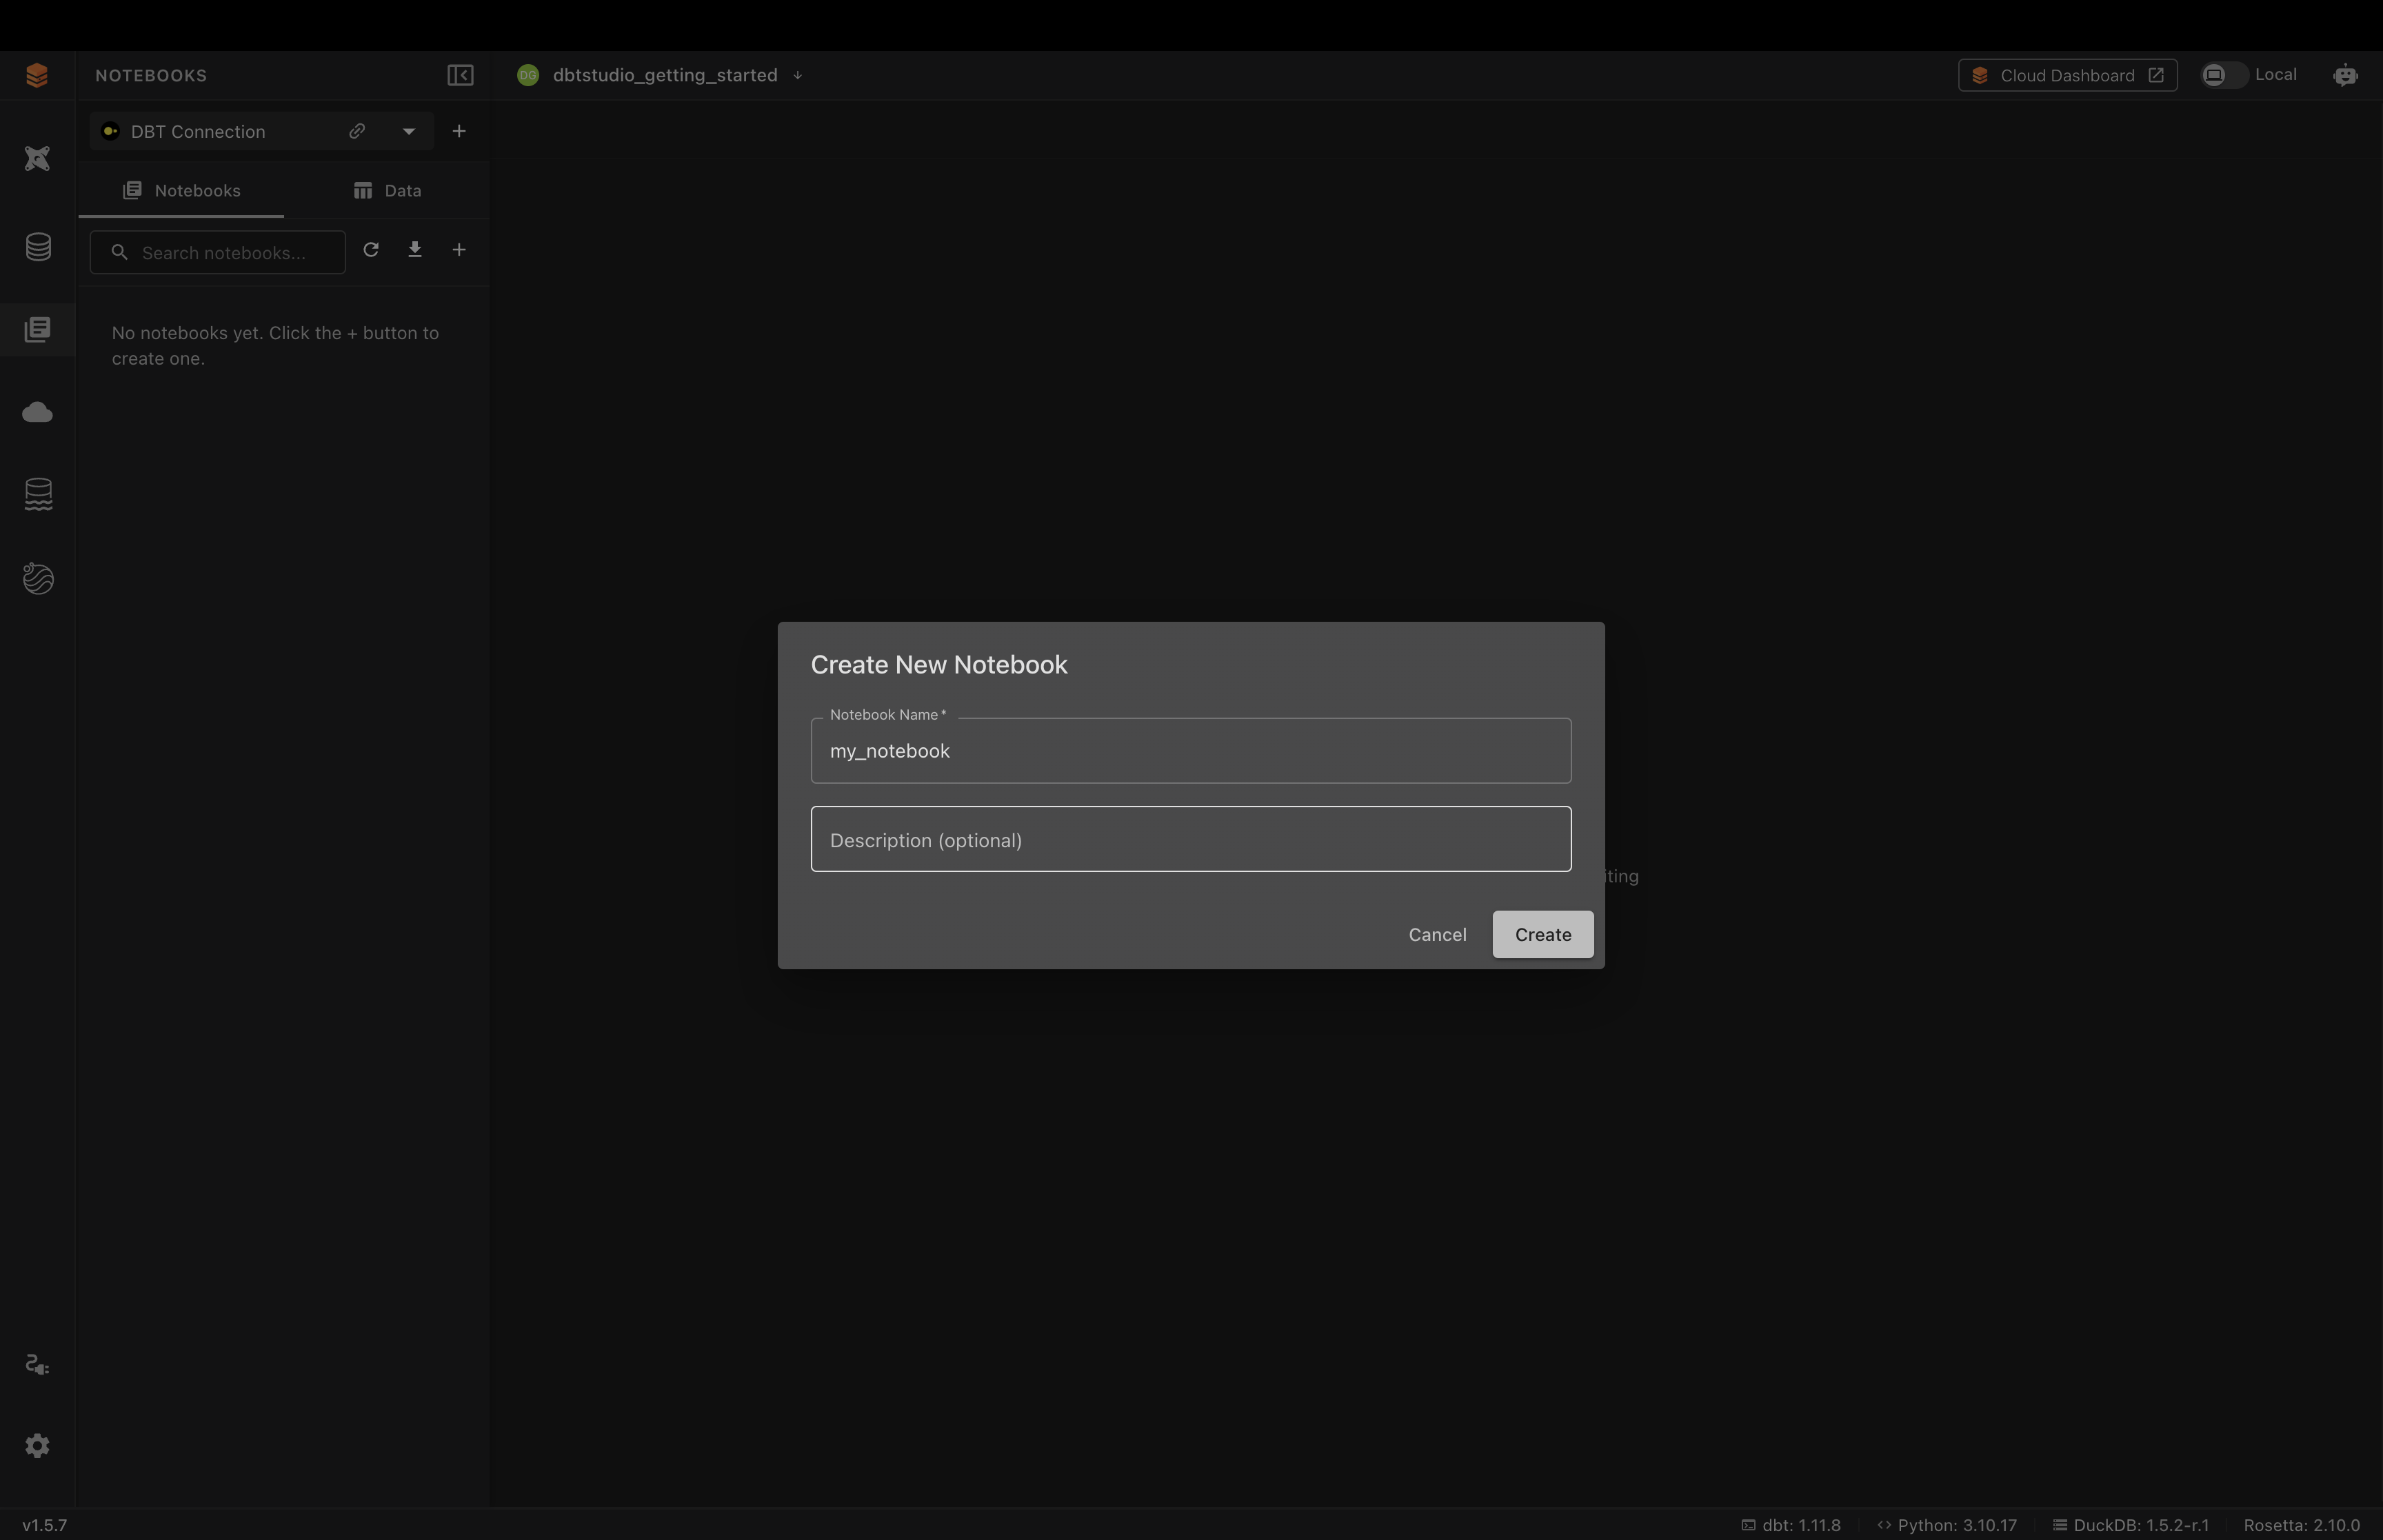
- Enter a Notebook Name and an optional Description
- Click Create
The new notebook opens, empty and ready for its first cell.
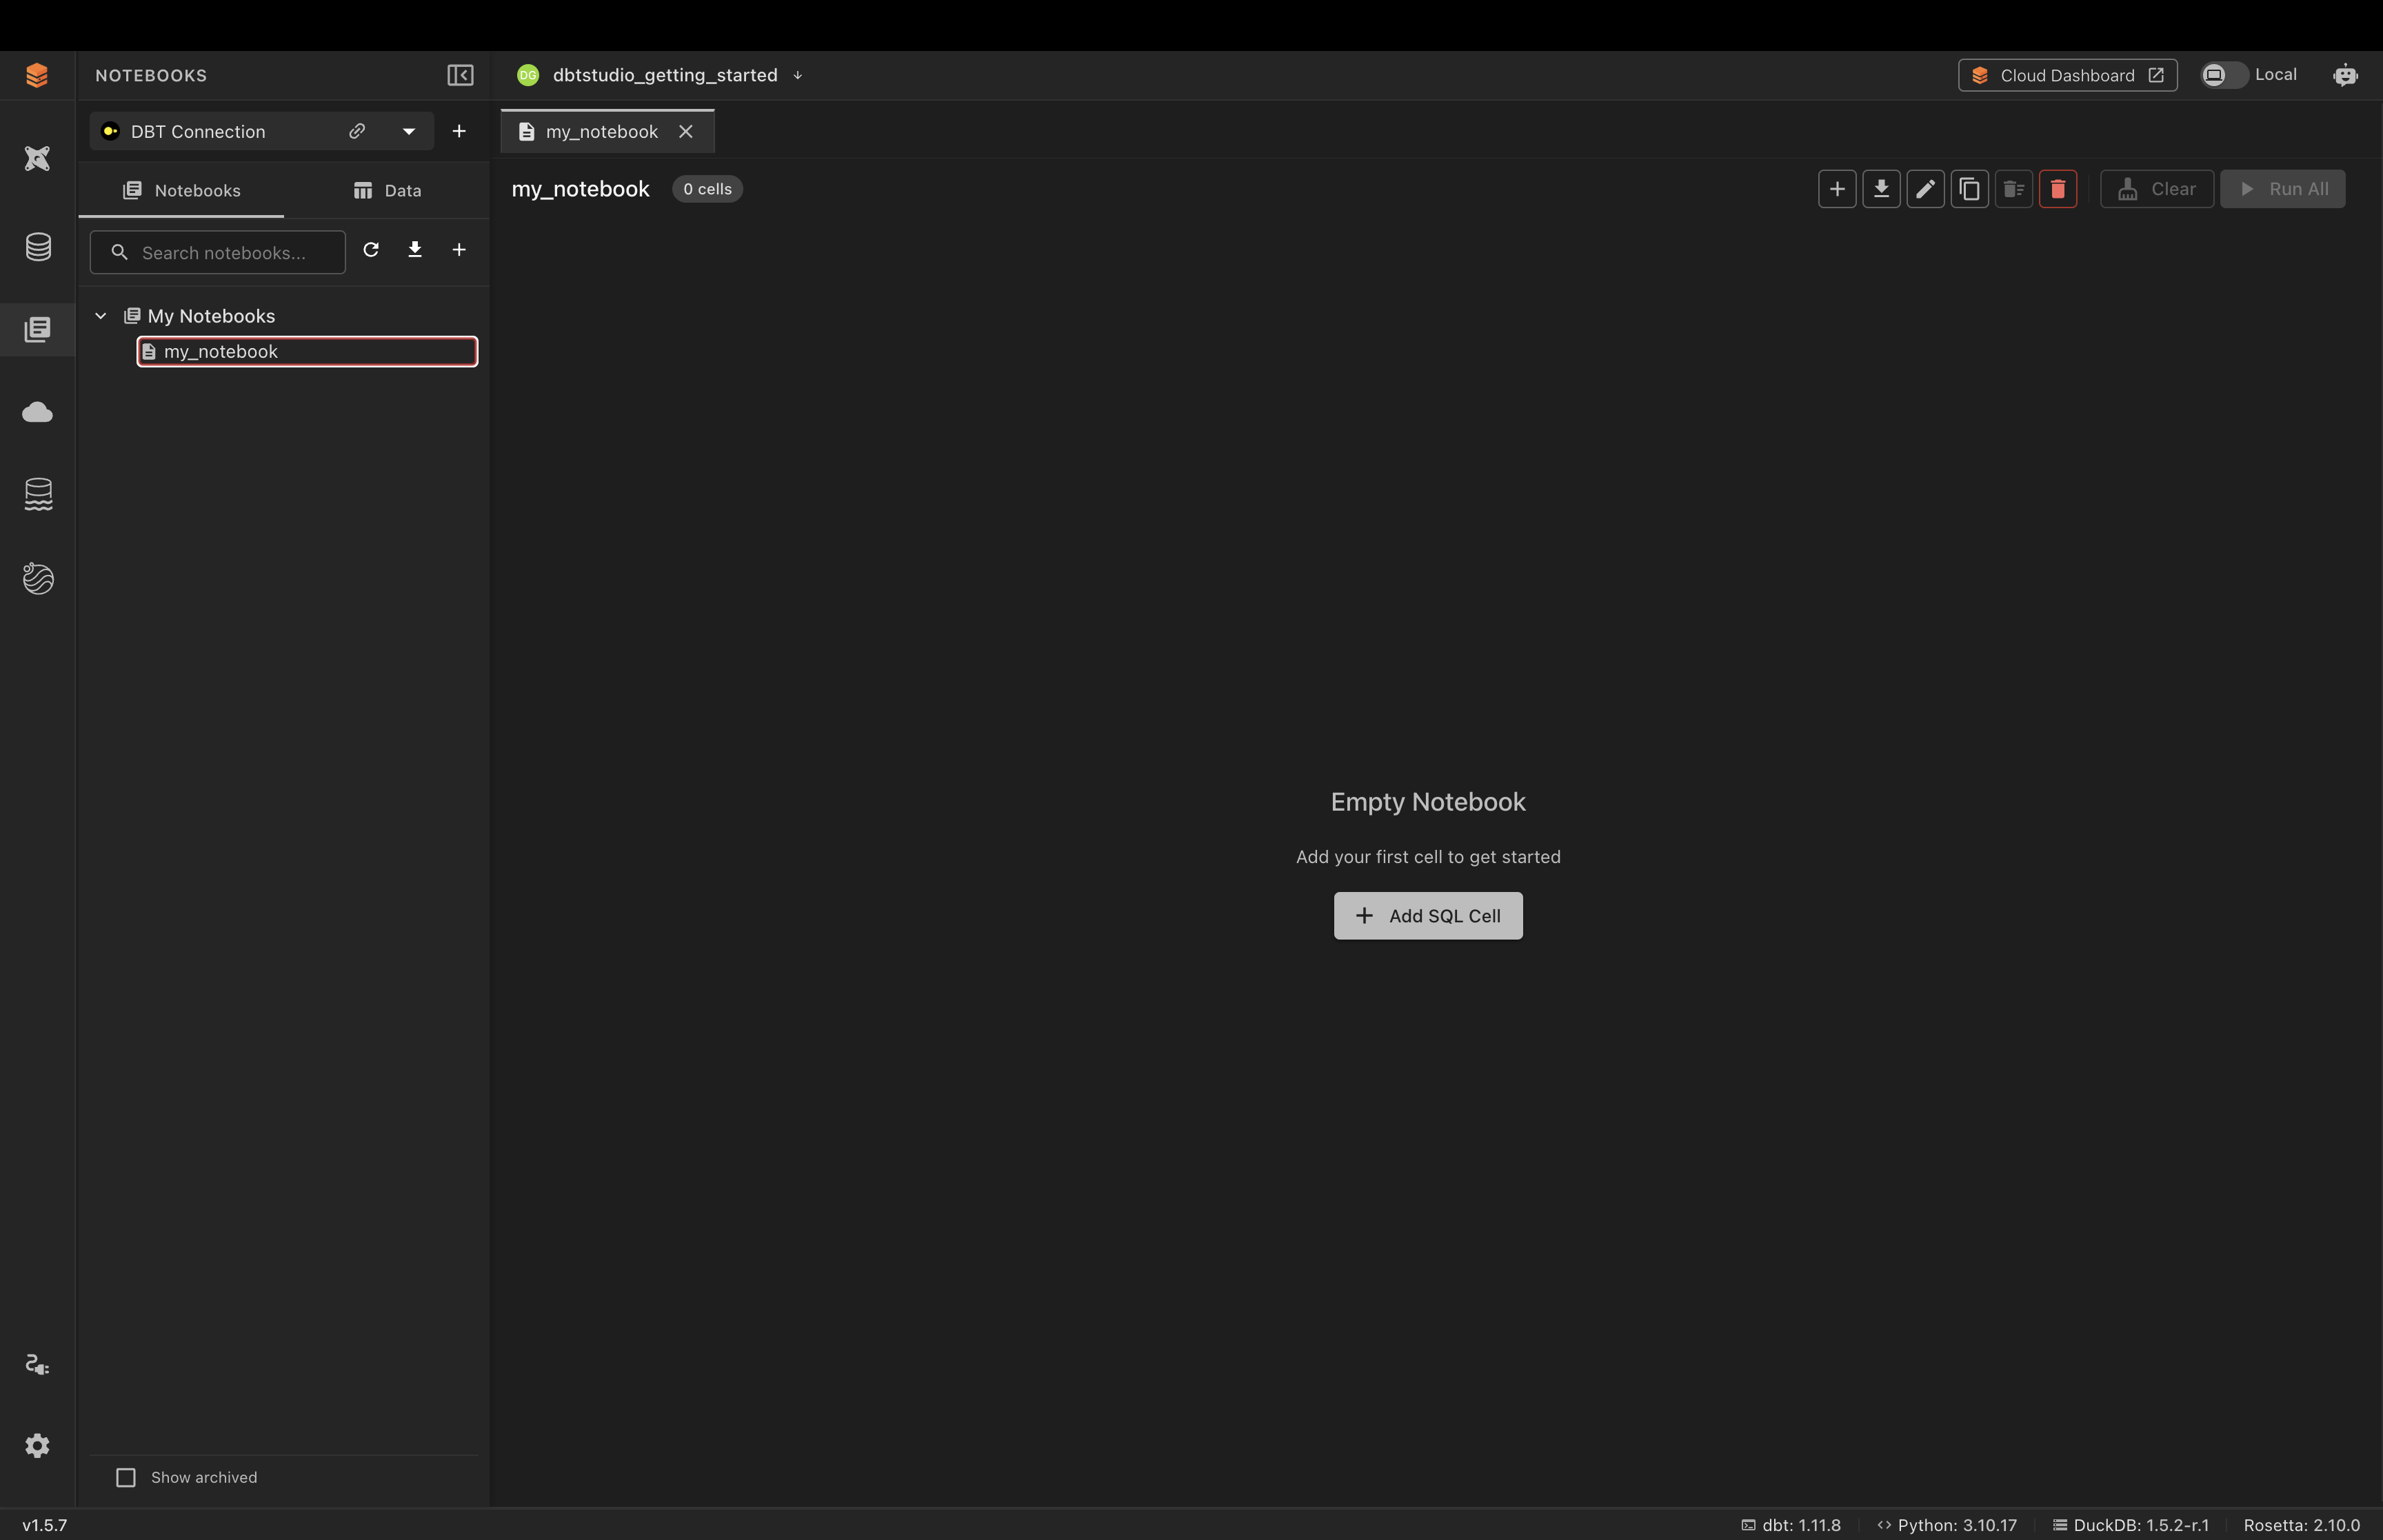
Tip: You can create multiple notebooks and switch between them from the Notebooks tab — for example, one per topic or investigation. Each opens in its own tab at the top.
Working with Cells
- Click Add SQL Cell (or the + in the toolbar)
- Type your SQL in the cell
- Run the cell with its Run (▶) button
- Click Add Cell to add another below, and repeat
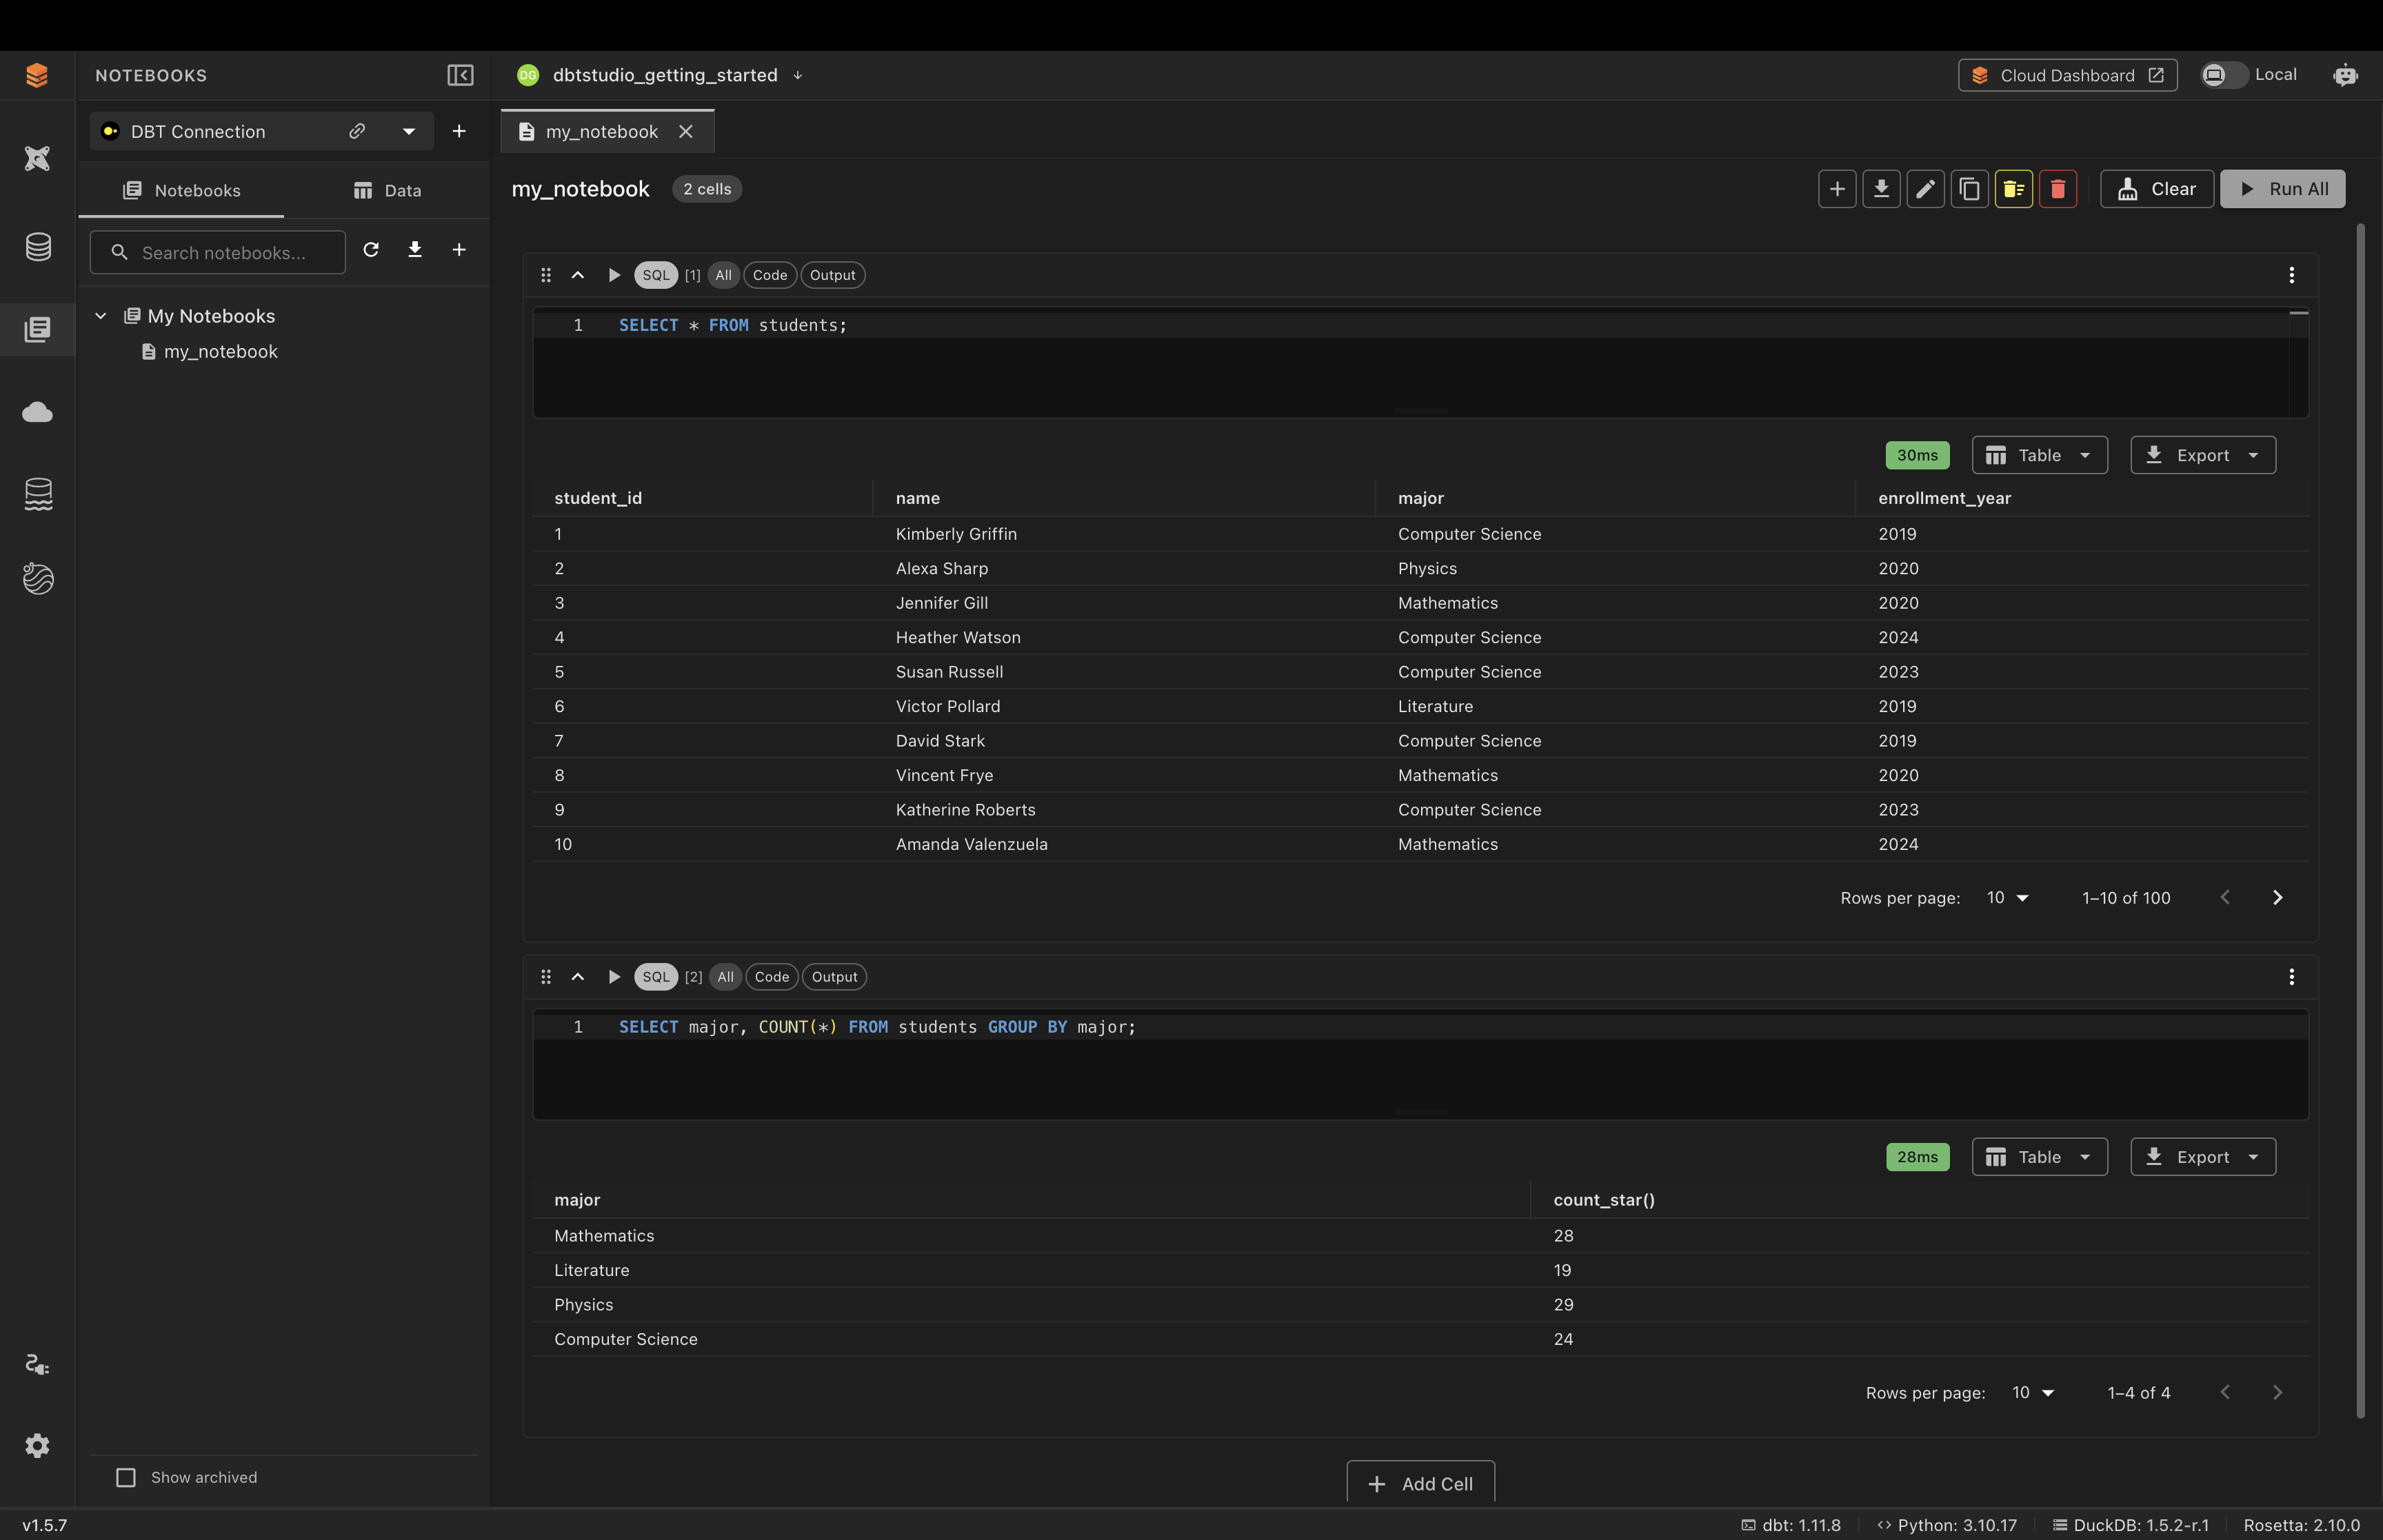
Each cell shows its own results underneath, with the query time, a view dropdown (Table or Chart), Export, and pagination. Cells are numbered ([1], [2]) in the order they run.
Tip: Use the All / Code / Output toggles on a cell to show both the SQL and its results, just the SQL, or just the results.
Viewing a Cell as a Chart
Just like the SQL Editor, each cell's results can be shown as a chart instead of a table.
- On a cell's result, open the view dropdown and choose Chart
- Use the Chart Configuration panel to set the Chart Type (Bar, Line, Pie, or Scatter Plot) and the X-Axis and Y-Axis columns
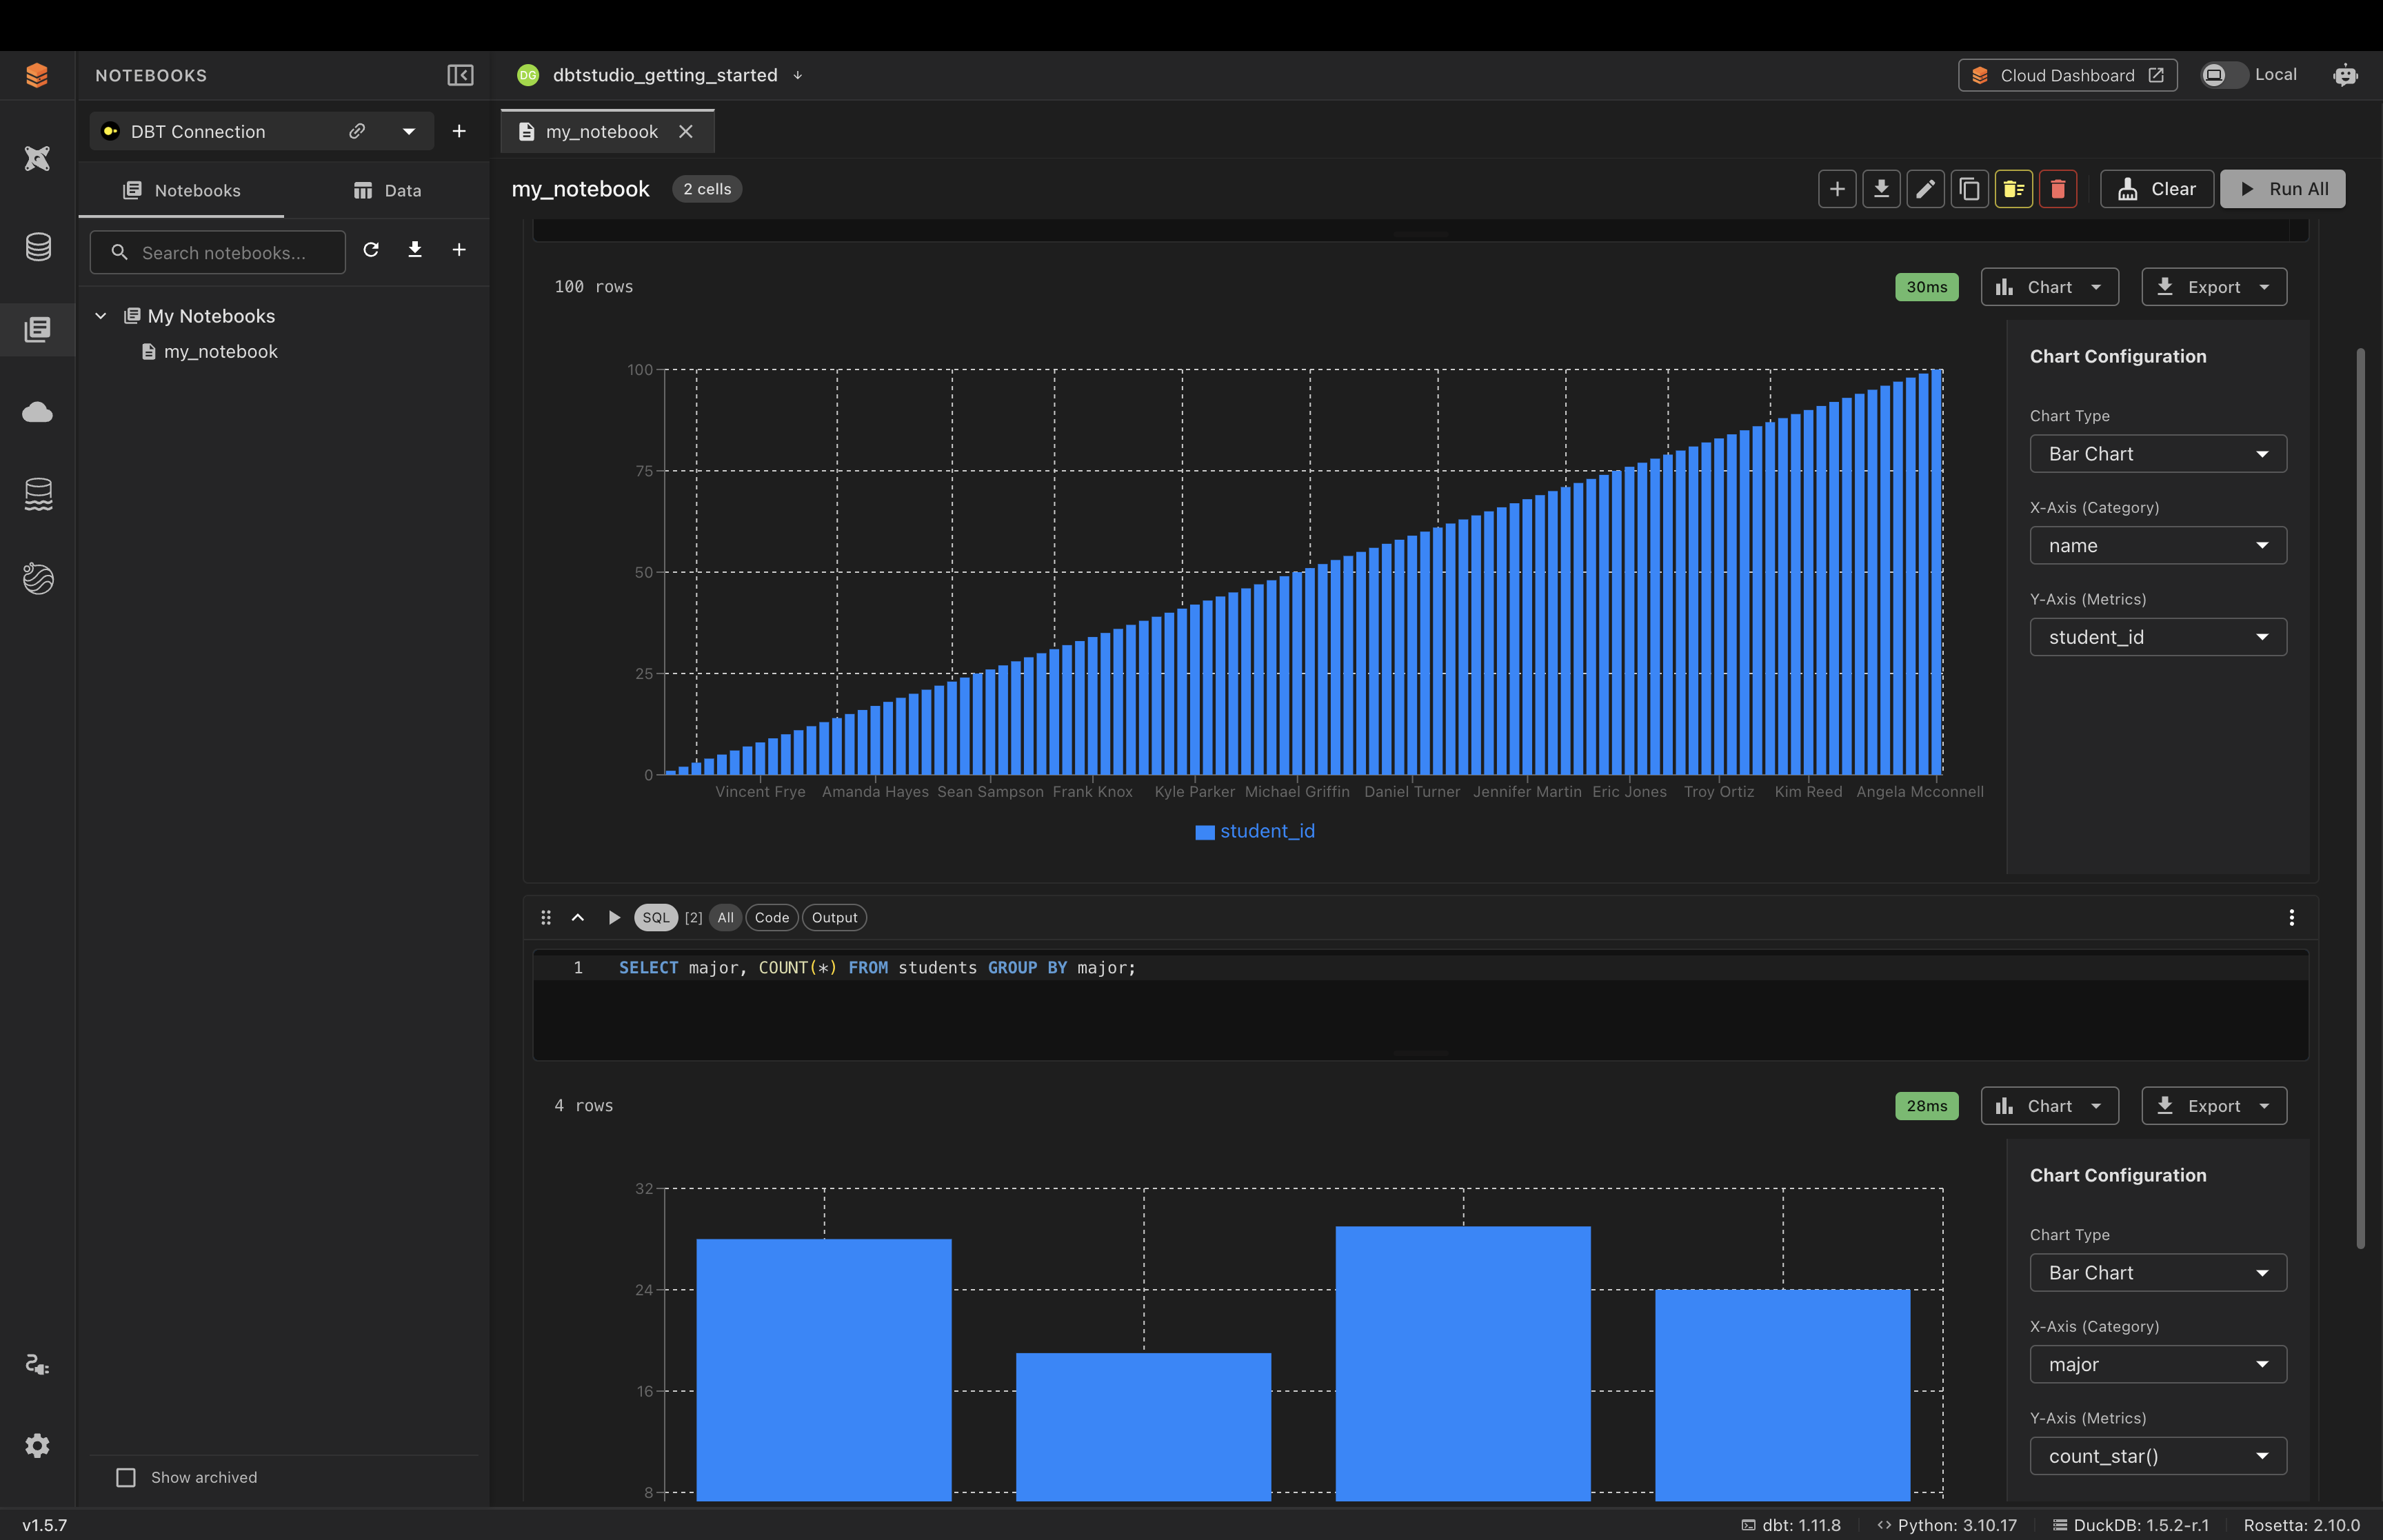
Because each cell has its own chart, you can build a notebook where different steps of your analysis are visualized in different ways.
Notebook Toolbar
The toolbar at the top right of an open notebook lets you:
- Add New Cell — add a new cell
- Export Notebook — download the notebook
- Edit Workbook — rename or edit its details
- Duplicate Workbook — make a copy
- Delete All Cells — empty the notebook
- Delete Workbook — remove it entirely
- Clear — clear all cell outputs
- Run All — run every cell top to bottom
Common Issues
No tables appear / cells return nothing → Confirm a connection is selected at the top of the panel, and that the table names in your SQL exist in the Data browser.
A cell shows an error → Check the SQL syntax in that specific cell — cells run independently.